Figures & data
Table I. Gene expression levels in TERT4 and TERT20.
Table II. Gene interaction networks.
Table III. Genes verified by q-RT-PCR.
Figure 1. Growth and SF curves for the TERT4 (●) and TERT20 (○) cell lines. A. Curves show the growth of the cell lines in vitro as a function of time after seeding the cells in T25 flasks. The lines were fitted by eye. B. SF for the cell lines measured 14 days after irradiating the cells in culture. The lines through the data are the linear-quadratic curves based on the alpha and beta values. For both the growth and SF data the points show means (± 1 S.E.) for a minimum of three values.
Figure 2. Heat map of those genes showing more than a five-fold altered regulation of expression levels, measured using the Affymetrix Human Exon array chip. Clustering analysis was achieved with Gene Cluster 2.11 using Pearson's correlation and complete linkage and visualised with Java Treeview. Hierarchical clustering of the data with median centred genes and complete linkage; red is up-regulated and green is down-regulated compared to the mean of the individual gene's expression levels. The genes TERT, CDKN2A and K-RAS were included as controls with known expression patterns.
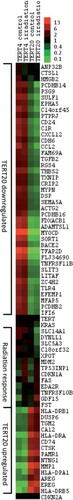
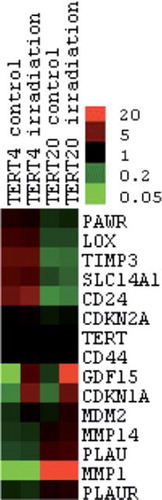
Figure 3. Heat map of the genes verified by q-RT-PCR. Clustering analysis was achieved with Gene Cluster 2.11 using Pearson's correlation and complete linkage and visualised with Java Treeview. Hierarchical clustering of the data with median centred genes and complete linkage; red is up-regulated and green is down-regulated compared to the mean of the individual gene's expression levels. The genes TERT and CDKN2A were included as controls with known expression patterns.