Figures & data
Table I. Patient characteristics.
Figure 1. Time-trend analysis of rectal volume variation during treatment. Thin dotted lines (& black squares): patients with significant trend (p < 0.05); grey squares: patients without trend; continuous thick black line: average values; thick black dotted line: polynomial fit of the average trend.
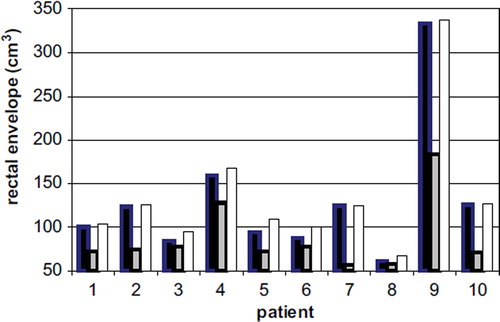
Figure 2. The volumes of the rectal envelope of the first half (dark), second half (grey) and total treatment (white) are plotted for each patient.
Figure 3. The mean similarity coefficients (DSC) referring to the agreement between the rectum at each kth fraction and at the others N-1 fractions are shown: the values significantly increase after the first few fractions.
Figure 4. The percentage of rectal envelope (with range) included in the expanded median rectum vs. isotropic margin referring to the whole treatment (dotted) and to the second half of the treatment (continuous).
Table II. Margins (in mm) corresponding to 90%, 95%, 98% of coverage probability of the rectal envelope for different reference rectal contours and considering the whole treatment or the second part only (mean values on 10 patients and min-max values, in brackets).