Figures & data
Table I. Patient cohort.
Figure 1. Dynamic 18FDG-PET sequence for patient 11 post injection showing the temporal evolution of the FDG activity. The tumor border is marked with a green line.
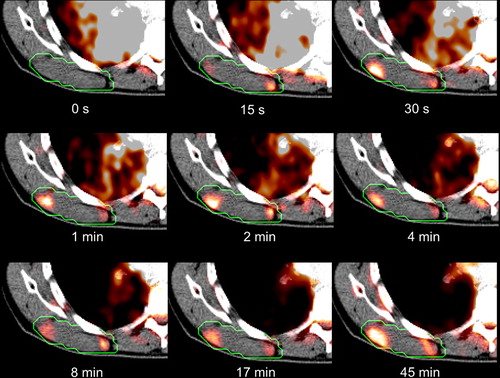
Figure 2. Time activity curves for patients 1-11 post injection showing the temporal development of the SUV peak value.
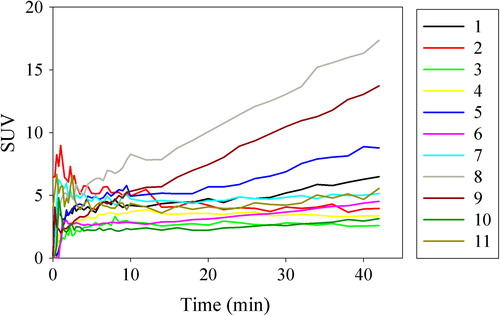
Figure 3. Two selected voxel elements for patient 10 post injection. Data points are averaged over the voxel in question and its six closest voxels. “Free” is non-metabolized 18FDG, “bound” is metabolized 18FDG, and “vascular” is the fraction of the plasma function included in the voxel element. Estimated pharmacokinetic parameters are given.
Figure 4. Parameter maps for patient 11 derived from the pharmacokinetic analysis. In addition, two static snapshot PET images obtained 2 and 45 min p.i. are shown. The tumor border is marked with a green line.
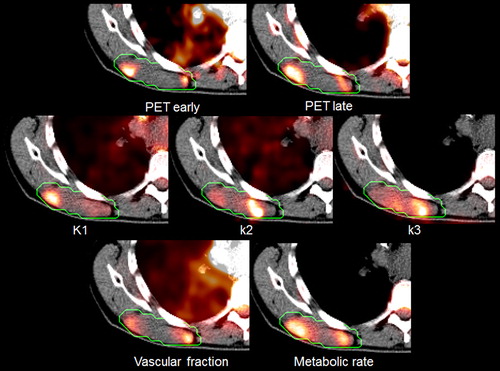
Figure 5. Patient-averaged histograms over the relevant PET-derived parameters. The dashed lines indicate one standard deviation.
Table II. Summary of PET-derived values.