Figures & data
Table I. Clinico-pathological and genetic characterization of 34 patients with gastrointestinal stromal tumor.
Figure 1. (A) Comparison of tumor-to blood activity concentrations between patients with GIST and NE tumors, i.e. medullary thyroid carcinoma (MTC) and midgut carcinoids (MC). The ratios are classified as groups dependent on disease type and time after injection. Data on T/B values in MTC and MC were from Forssell-Aronsson et al. [Citation18]. In general MC had higher ratios than MTC (biopsied according to the same time scale). On the other hand, GIST were biopsied according to a protracted time scale making direct comparison difficult. However, the GIST patient with highest T/B ratio (96) long time after injection (13 days) seemed to be suitable for PRRT. (B) Comparison of SSTR mRNA values in GIST tumors (n = 34) compared to NE tumors (MTC, n = 5; MC, n = 12). MTC and MC showed high expression of SSTR2&5 (with high affinity for octreotide/octreotate), while GIST have much lower expression of these two receptor subtypes.
![Figure 1. (A) Comparison of tumor-to blood activity concentrations between patients with GIST and NE tumors, i.e. medullary thyroid carcinoma (MTC) and midgut carcinoids (MC). The ratios are classified as groups dependent on disease type and time after injection. Data on T/B values in MTC and MC were from Forssell-Aronsson et al. [Citation18]. In general MC had higher ratios than MTC (biopsied according to the same time scale). On the other hand, GIST were biopsied according to a protracted time scale making direct comparison difficult. However, the GIST patient with highest T/B ratio (96) long time after injection (13 days) seemed to be suitable for PRRT. (B) Comparison of SSTR mRNA values in GIST tumors (n = 34) compared to NE tumors (MTC, n = 5; MC, n = 12). MTC and MC showed high expression of SSTR2&5 (with high affinity for octreotide/octreotate), while GIST have much lower expression of these two receptor subtypes.](/cms/asset/2460d324-ee3c-4fcd-a1d9-92cb792e6c0f/ionc_a_733075_f0001_b.gif)
Table II. Expression profiles of somatostatin receptors in gastrointestinal stromal tumors. Biopsies from 34 patients with GIST were analyzed by real-time qPCR and IHC. qPCR values are expressed as fold change of target gene per 1000 ACTB copies. IHC labeling was scored as the number of positive tumor cells: - = no labeling, 1+ = 10–25%, 2+ = 25–75%, 3+ = > 75%.
Figure 2. Expression of somatostatin receptor protein in GIST. SSTR1, 2, 3, and 5 proteins localized to tumor cell cytoplasm. SSTR4 protein was undetectable. Immunoperoxidase staining of consecutive sections from tumor biopsy from patient no. 12 (small intestinal, low-risk, wt in KIT and PDGFRA). Brown = antibody labeling. Blue = nuclear counter staining. Left panel (A, C, E, G, I): low power (bar equals 50 μm). Right panel (B, D, F, H, J): high power (bar equals 20 μm). *indicates luminal side of vascular profile.
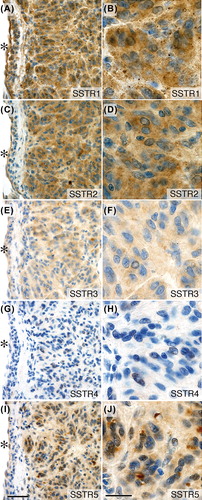
Figure 3. GIST in primary culture. Tumor cells were positive for the GIST markers KIT and DOG1 (ANO1). The marker CD34 was positive in one tumor. Tumor cells also expressed SSTR1 and 2 with membrane and cytoplasmic labeling. (A–E) Patient no. 15 (gastric, low-risk, PDGFRA exon 18 (D842V) missense mutation). (F–J) Patient no. 25 (small intestinal, high-risk, KIT exon 11 (P573_Y578) duplication mutation). Immunofluorescent labeling and confocal laser microscopy; antibody labeling in green color and DAPI-stained nuclei in blue color. Bar equals 20 μm.
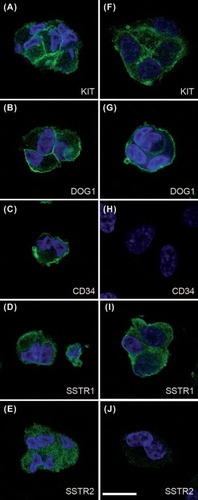
Figure 4. SSTR scintigraphy and tumor-to-blood 111In activity concentration ratios (T/B) in tumor biopsies from GIST patients injected with 111In-DTPA-D-Phe1-octreotide. (A) Tumor imaging of patient no. 25 with primary small intestinal GIST non-radically resected, and multiple abdominal (arrows) and liver (double arrow) recurrences four years after primary surgery. The primary tumor had KIT exon 11 duplication mutation and responded to imatinib. (B) Tumor imaging of patient no. 29 with primary GIST close to the ligament of Treitz (arrow) and multiple liver metastases in the right liver lobe (double arrow). This patient was wt for KIT and PDGFRA and resistant to imatinib. The patient survived for only two years after surgery. (C) Summary of observations at SSTR-scintigraphy and maximal T/B values in GIST patients.
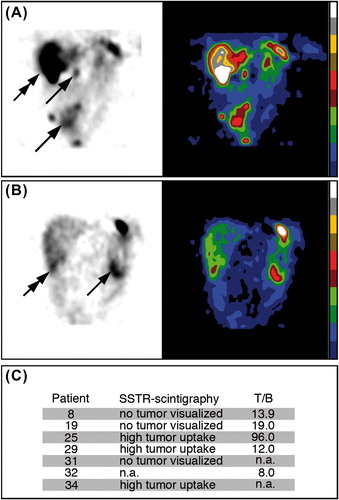
Figure 5. Binding and internalization of 177Lu-DOTA-Tyr3-octreotate in cultured GIST cells. Tumor cells were cultured with 177Lu-octreotate (10 nM) with or without unlabeled octreotide (5 μM). The fraction of unbound, surface-bound, and internalized 177Lu in GIST tumor cells was measured after 4, 24, and 48 hours. Values represent mean of 4–8 replicates. Error bars are smaller than symbols. Internalization of 177Lu was significantly higher in 177Lu-octreotate-incubated tumor cells than in controls (p < 10-15). The amount of internalized 177Lu increased steadily during the incubation period. (A–C) Patient no. 15 (gastric, low-risk, PDGFRA exon 18 (D842V) missense mutation; SSTR1/2 mRNA values: 107/0.38). (D–F) Patient no. 25 [small intestine, high-risk, KIT exon 11 (P573_Y578) duplication mutation; SSTR1/2 mRNA values: 445/0.60; clearly positive imaging; T/B: 96]. Further statistical details are presented in Supplementary Table 2 to be found online at http://informahealthcare.com/doi/abs/10.3109/0284186X.2012.733075.
![Figure 5. Binding and internalization of 177Lu-DOTA-Tyr3-octreotate in cultured GIST cells. Tumor cells were cultured with 177Lu-octreotate (10 nM) with or without unlabeled octreotide (5 μM). The fraction of unbound, surface-bound, and internalized 177Lu in GIST tumor cells was measured after 4, 24, and 48 hours. Values represent mean of 4–8 replicates. Error bars are smaller than symbols. Internalization of 177Lu was significantly higher in 177Lu-octreotate-incubated tumor cells than in controls (p < 10-15). The amount of internalized 177Lu increased steadily during the incubation period. (A–C) Patient no. 15 (gastric, low-risk, PDGFRA exon 18 (D842V) missense mutation; SSTR1/2 mRNA values: 107/0.38). (D–F) Patient no. 25 [small intestine, high-risk, KIT exon 11 (P573_Y578) duplication mutation; SSTR1/2 mRNA values: 445/0.60; clearly positive imaging; T/B: 96]. Further statistical details are presented in Supplementary Table 2 to be found online at http://informahealthcare.com/doi/abs/10.3109/0284186X.2012.733075.](/cms/asset/571ef07c-26dc-487f-a998-e4a101fdfef1/ionc_a_733075_f0005_b.gif)