Figures & data
Table I. Demographic and clinical characteristics of long-term survivors with or without ‘emptying of all stools into clothing without forewarning'after pelvic radiation therapy at time of follow-up.
Table II. Treatment characteristics of long-term survivors with and without ‘emptying of all stools into clothing without forewarning’.
Table III. Mean and maximum absorbed doses for the four OARs and association tests (AUC, t-test p-value), comparing patients with and without the symptom of ‘emptying of all stools into clothing without forewarning’. Correlation coefficients (r) between mean and maximum absorbed doses.
Figure 1. Dose-volume histograms of the anal-sphincter region, the rectum, the sigmoid and the small intestines for survivors who developed the symptom (solid line) and survivors who did not develop the symptom (dashed-line).
Table IV. The maximum likelihood estimates of the dose-response parameters for the three OARs using RS, Lyman, gEUD model and the values for the AUC (area under the ROC curve).
Figure 2. Dose-response curves using the Relative Seriality and Lyman model, for the anal-sphincter region, rectum, sigmoid and small intestines.
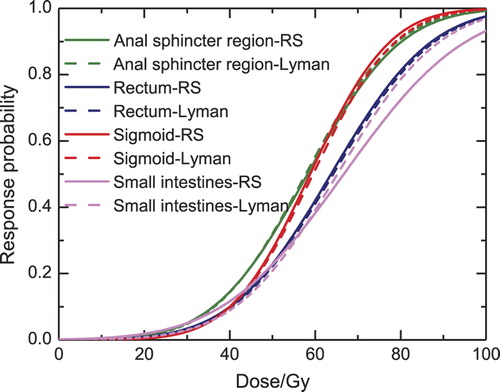
Figure 3. Volume effect using the Relative Seriality model for the sigmoid, assuming that the whole organ (100%) receives a uniform dose; two thirds (67%) of the organ receives a uniform dose and the remaining part receives 5% of this dose; and one third (33%) of the organ receives a uniform dose and the rest 5% of this dose. The light grey lines show the survivors with the symptom (responders) and the dark grey lines the survivors without the symptom (non-responders).