2,089
Views
19
CrossRef citations to date
0
Altmetric
Original Articles

Early growth response gene-1 and hypoxia-inducible factor-1α affect tumor metastasis via regulation of tissue factor

, , , , , , & show all
Pages 842-851 | Received 08 Mar 2012, Accepted 19 Jun 2012, Published online: 14 Feb 2013

Figures & data

Figure 1. Egr-1 is responsible for hypoxia-induced TF expression in human breast cancer cells. To create hypoxic conditions, cells were placed in an anaerobic chamber with 1% O2 and 5% CO2 at 37°C. (A) Egr-1 mRNA expression was analyzed by qRT-PCR and expression was recorded as the fold increase compared to that in normoxia. Values are mean ± SD for five experiments. **p < 0.01 vs. that of normoxia; (B) Western blot showing a marked increase in Egr-1 protein expression at both 1 and 12 h of hypoxia. Egr-1 siRNA significantly inhibited the hypoxia-mediated up-regulation of Egr-1 protein; (C) qRT-PCR for TF mRNA expression. Values are mean ± SD for five experiments. **p < 0.01 vs. that in normoxia; ##p < 0.01 vs. that in hypoxia; (D) The representative immunoblots show that hypoxia (12 h) strongly increased TF protein expression and this hypoxia-mediated up-regulation of TF protein was inhibited greatly by Egr-1 siRNA; (E) The activity of TF induced by hypoxia (12 h) was inhibited greatly by Egr-1 siRNA. Values are mean ± SD for five experiments. *p < 0.05 vs. that of normoxia; #p < 0.05 vs. that in hypoxia.
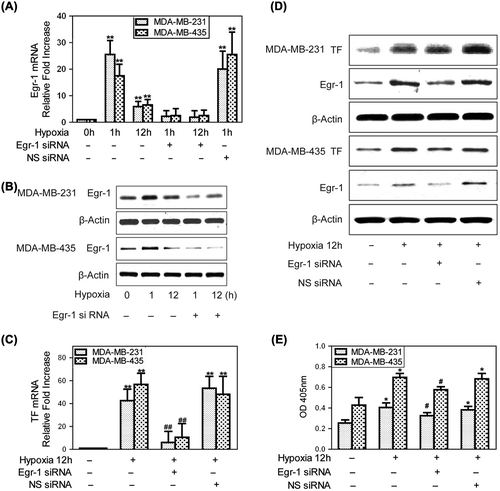
Figure 1. Egr-1 is responsible for hypoxia-induced TF expression in human breast cancer cells. To create hypoxic conditions, cells were placed in an anaerobic chamber with 1% O2 and 5% CO2 at 37°C. (A) Egr-1 mRNA expression was analyzed by qRT-PCR and expression was recorded as the fold increase compared to that in normoxia. Values are mean ± SD for five experiments. **p < 0.01 vs. that of normoxia; (B) Western blot showing a marked increase in Egr-1 protein expression at both 1 and 12 h of hypoxia. Egr-1 siRNA significantly inhibited the hypoxia-mediated up-regulation of Egr-1 protein; (C) qRT-PCR for TF mRNA expression. Values are mean ± SD for five experiments. **p < 0.01 vs. that in normoxia; ##p < 0.01 vs. that in hypoxia; (D) The representative immunoblots show that hypoxia (12 h) strongly increased TF protein expression and this hypoxia-mediated up-regulation of TF protein was inhibited greatly by Egr-1 siRNA; (E) The activity of TF induced by hypoxia (12 h) was inhibited greatly by Egr-1 siRNA. Values are mean ± SD for five experiments. *p < 0.05 vs. that of normoxia; #p < 0.05 vs. that in hypoxia.

Figure 2. Hypoxia-mediated up-regulation of TF expression is independent on Sp1. To create hypoxic conditions, cells were placed in an anaerobic chamber with 1% O2 and 5% CO2 at 37°C. (A) MDA-MB-231 and MDA-MB-435 cells were transfected with Sp1 siRNA or non-specific siRNA the day before hypoxia treatment. Hypoxia (12 h) caused a large increase in TF mRNA expression, which was not affected by Sp1 siRNA treatment. Fold increase normalized to normoxia. Values are mean ± SD for five experiments. **p < 0.01 vs. that of normoxia; (B) Sp1 siRNA in MDA-MB-231 cells significantly inhibited Sp1 protein levels but did not affect the marked hypoxic up-regulation of TF.
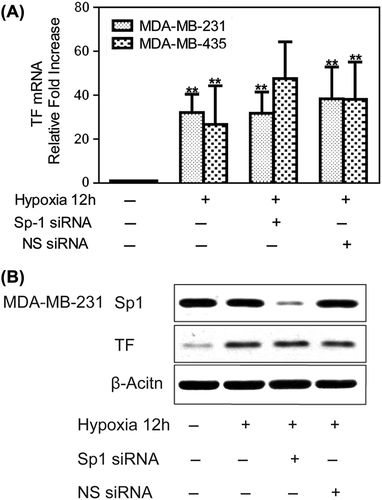
Figure 2. Hypoxia-mediated up-regulation of TF expression is independent on Sp1. To create hypoxic conditions, cells were placed in an anaerobic chamber with 1% O2 and 5% CO2 at 37°C. (A) MDA-MB-231 and MDA-MB-435 cells were transfected with Sp1 siRNA or non-specific siRNA the day before hypoxia treatment. Hypoxia (12 h) caused a large increase in TF mRNA expression, which was not affected by Sp1 siRNA treatment. Fold increase normalized to normoxia. Values are mean ± SD for five experiments. **p < 0.01 vs. that of normoxia; (B) Sp1 siRNA in MDA-MB-231 cells significantly inhibited Sp1 protein levels but did not affect the marked hypoxic up-regulation of TF.

Figure 3. Hypoxia-mediated up-regulation of TF expression is dependent on HIF-1α and VEGF. Human breast cancer cells were transfected with siRNA against HIF-1α during incubation in normoxia for 24 h. The cells were then incubated in 1% oxygen for 12 h before harvesting. (A) Western blots showing a marked increase in HIF-1α and TF protein expression at 12 h of hypoxia. TF protein expression could be attenuated by HIF-1α siRNA. (B) Western blots showing that Egr-1 siRNA did not affect HIF-1α expression. (C) Knockdown of HIF-1α decreased hypoxia-mediated up-regulation of TF activity in MDA-MB-231 and MDA-MB-435 cells. Values are mean ± SD for five experiments. **p < 0.01 vs. that in normoxia; #p < 0.05 vs. that in hypoxia; (D) HIF-1α siRNA attenuated hypoxia-induced VEGF secretion. Conditioned medium was collected, and VEGF was measured by ELISA. Values are mean ± SD for five experiments. **p < 0.01 vs. that in normoxia; ##p < 0.01 vs. that in hypoxia.
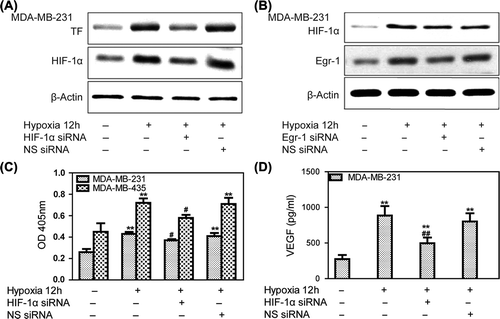
Figure 3. Hypoxia-mediated up-regulation of TF expression is dependent on HIF-1α and VEGF. Human breast cancer cells were transfected with siRNA against HIF-1α during incubation in normoxia for 24 h. The cells were then incubated in 1% oxygen for 12 h before harvesting. (A) Western blots showing a marked increase in HIF-1α and TF protein expression at 12 h of hypoxia. TF protein expression could be attenuated by HIF-1α siRNA. (B) Western blots showing that Egr-1 siRNA did not affect HIF-1α expression. (C) Knockdown of HIF-1α decreased hypoxia-mediated up-regulation of TF activity in MDA-MB-231 and MDA-MB-435 cells. Values are mean ± SD for five experiments. **p < 0.01 vs. that in normoxia; #p < 0.05 vs. that in hypoxia; (D) HIF-1α siRNA attenuated hypoxia-induced VEGF secretion. Conditioned medium was collected, and VEGF was measured by ELISA. Values are mean ± SD for five experiments. **p < 0.01 vs. that in normoxia; ##p < 0.01 vs. that in hypoxia.

Figure 4. Effects of Egr-1 and HIF-1α on tumor cell adhesion in vitro. To create hypoxic conditions, cells were placed in an anaerobic chamber with 1% O2 and 5% CO2 at 37°C. (A) MDA-MB-231 cells adhered weakly to vitronectin and fibronectin in normoxia. After 1 h of hypoxia, adhesion of MDA-MB-321 cells to vitronectin markedly increased. Egr-1 siRNA attenuated this hypoxia-induced adhesion of the cancer cells. (B) HIF-1α siRNA decreased the hypoxia-induced adhesion of breast cancer cells. (C) Treatment with a function-blocking anti-β3 integrin antibody and RGD (0.5 g/l) inhibited the adhesion of human breast cancer cells to vitronectin, indicating that this process is mediated specifically via αvβ3 integrin. (D) MDA-MB-231 cells were transfected with Egr-1 or HIF-1α siRNA 24 h before hypoxia treatment and analyzed for αvβ3 expression by Western blot. Egr-1 siRNA or HIF-1α siRNA affected αvβ3 expression.
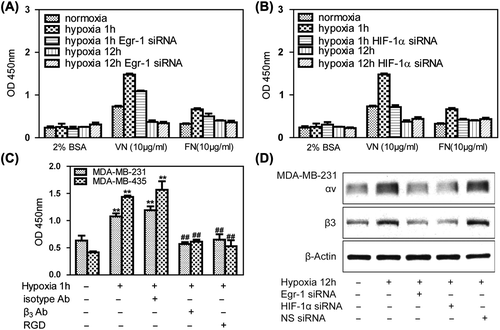
Figure 4. Effects of Egr-1 and HIF-1α on tumor cell adhesion in vitro. To create hypoxic conditions, cells were placed in an anaerobic chamber with 1% O2 and 5% CO2 at 37°C. (A) MDA-MB-231 cells adhered weakly to vitronectin and fibronectin in normoxia. After 1 h of hypoxia, adhesion of MDA-MB-321 cells to vitronectin markedly increased. Egr-1 siRNA attenuated this hypoxia-induced adhesion of the cancer cells. (B) HIF-1α siRNA decreased the hypoxia-induced adhesion of breast cancer cells. (C) Treatment with a function-blocking anti-β3 integrin antibody and RGD (0.5 g/l) inhibited the adhesion of human breast cancer cells to vitronectin, indicating that this process is mediated specifically via αvβ3 integrin. (D) MDA-MB-231 cells were transfected with Egr-1 or HIF-1α siRNA 24 h before hypoxia treatment and analyzed for αvβ3 expression by Western blot. Egr-1 siRNA or HIF-1α siRNA affected αvβ3 expression.

Figure 5. Effects of Egr-1 and HIF-1α on tumor cell migration in vitro. To create hypoxic conditions, cells were placed in an anaerobic chamber with 1% O2 and 5% CO2 at 37°C. (A) Cell invasion was greatly increased under hypoxia. HIF-1α siRNA attenuated hypoxia-induced invasion of cancer cells, while Egr-1 just moderately decreased the cell invasion using 2% FBS as the chemoattractant. Average numbers of cells migrating in five randomly selected fields were counted 12 h after seeding. (B) Effects of Egr-1 and HIF-1α siRNA on MMP-2 or MMP-9 secretion. After blocking HIF-1α expression with 50 nM HIF-1α siRNA, MDA-MB-231 cells were cultured under hypoxic conditions in serum-free medium for 12 h; the conditioned media were collected and analyzed by ELISA. A decreased amount of MMP-9 was secreted in response to HIF-1α RNAi.
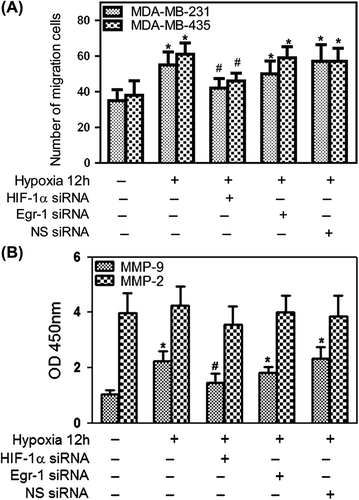
Figure 5. Effects of Egr-1 and HIF-1α on tumor cell migration in vitro. To create hypoxic conditions, cells were placed in an anaerobic chamber with 1% O2 and 5% CO2 at 37°C. (A) Cell invasion was greatly increased under hypoxia. HIF-1α siRNA attenuated hypoxia-induced invasion of cancer cells, while Egr-1 just moderately decreased the cell invasion using 2% FBS as the chemoattractant. Average numbers of cells migrating in five randomly selected fields were counted 12 h after seeding. (B) Effects of Egr-1 and HIF-1α siRNA on MMP-2 or MMP-9 secretion. After blocking HIF-1α expression with 50 nM HIF-1α siRNA, MDA-MB-231 cells were cultured under hypoxic conditions in serum-free medium for 12 h; the conditioned media were collected and analyzed by ELISA. A decreased amount of MMP-9 was secreted in response to HIF-1α RNAi.

Figure 6. Effects of Egr-1 and HIF-1α on vascular tubule formation in vitro. To create hypoxic conditions, cells were placed in an anaerobic chamber with 1% O2 and 5% CO2 at 37°C. (A) HUVEC co-culture with MDA-MB-231 model was performed using transwell chambers adapted to 24-well format. The breast cancer cells were pretreated with Egr-1 or HIF-1α siRNA seeded in upper chambers, then co-cultured with HUVEC seeded in 24-well further incubated in normoxia or hypoxia conditions. (B) Vascular tubule formation was not different when HUVECs were incubated in hypoxia or in nomoxia or co-cultured with MDA-MB-231 cells in normoxia alone. When co-cultured with tumor cells in hypoxia, the capacity of endothelial cells to form tubules was enhanced significantly. Both Egr-1 siRNA and HIF-1α siRNA could inhibit vascular tubule formation (200× .1. Normoxia; 2. Normoxia + co-culture; 3. Hypoxia; 4. Hypoxia + co-culture; 5. Hypoxia + co-culture + Egr-1 siRNA; 6. Hypoxia + co-culture + HIF-1α siRNA). (C) Conditioned medium was collected from normoxic or hypoxic conditions of (B) and VEGF was measured by ELISA. VEGF levels in conditioned medium from hypoxia co-cultured cells higher than that from HUVEC cultured under normoxia. Values are mean ± SD for five experiments. **p < 0.01 vs. that in normoxia; ##p < 0.01 vs. that in hypoxia co-culture.
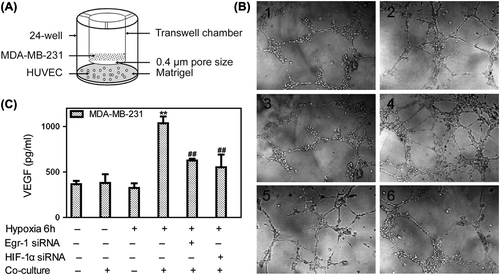
Figure 6. Effects of Egr-1 and HIF-1α on vascular tubule formation in vitro. To create hypoxic conditions, cells were placed in an anaerobic chamber with 1% O2 and 5% CO2 at 37°C. (A) HUVEC co-culture with MDA-MB-231 model was performed using transwell chambers adapted to 24-well format. The breast cancer cells were pretreated with Egr-1 or HIF-1α siRNA seeded in upper chambers, then co-cultured with HUVEC seeded in 24-well further incubated in normoxia or hypoxia conditions. (B) Vascular tubule formation was not different when HUVECs were incubated in hypoxia or in nomoxia or co-cultured with MDA-MB-231 cells in normoxia alone. When co-cultured with tumor cells in hypoxia, the capacity of endothelial cells to form tubules was enhanced significantly. Both Egr-1 siRNA and HIF-1α siRNA could inhibit vascular tubule formation (200× .1. Normoxia; 2. Normoxia + co-culture; 3. Hypoxia; 4. Hypoxia + co-culture; 5. Hypoxia + co-culture + Egr-1 siRNA; 6. Hypoxia + co-culture + HIF-1α siRNA). (C) Conditioned medium was collected from normoxic or hypoxic conditions of (B) and VEGF was measured by ELISA. VEGF levels in conditioned medium from hypoxia co-cultured cells higher than that from HUVEC cultured under normoxia. Values are mean ± SD for five experiments. **p < 0.01 vs. that in normoxia; ##p < 0.01 vs. that in hypoxia co-culture.

Figure 7. Extravasation analysis of MDA-MB-435 cells in nude mice. (A) Fluorescence micrograph of frozen sections of a nude mouse lung at 7 h after tail vein injection of red CMRA-labeled Egr-1 siRNA treated MDA-MB-435 cells mixed 1:1 with green CMFDA-labeled normal MDA-MB-435 cells. (B) Tumor cell count ratios (green CMFDA-labeled normal MDA-MB-435 cells/red CMRA-labeled Egr-1 siRNA treated MDA-MB-435 cells) in lung at 15 min and 7 h after tail vein injection (n = 6, mean ± SD, **p < 0.01 compared with 1:1 cell mixtures). (C) Fluorescence micrograph of frozen sections of a nude mouse lung at 7 h after tail vein injection of red CMRA-labeled HIF-1α siRNA treated MDA-MB-435 cells mixed 1:1 with green CMFDA-labeled normal MDA-MB-435 cells. (D) Tumor cell count ratios (green CMFDA-labeled normal MDA-MB-435 cells/red CMRA-labeled HIF-1α siRNA treated MDA-MB-435 cells) in lung at 15 min and 7 h after tail vein injection (n = 6, mean ± SD, **p < 0.01 compared with 1:1 cell mixtures).
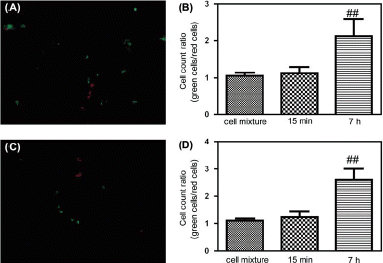
Figure 7. Extravasation analysis of MDA-MB-435 cells in nude mice. (A) Fluorescence micrograph of frozen sections of a nude mouse lung at 7 h after tail vein injection of red CMRA-labeled Egr-1 siRNA treated MDA-MB-435 cells mixed 1:1 with green CMFDA-labeled normal MDA-MB-435 cells. (B) Tumor cell count ratios (green CMFDA-labeled normal MDA-MB-435 cells/red CMRA-labeled Egr-1 siRNA treated MDA-MB-435 cells) in lung at 15 min and 7 h after tail vein injection (n = 6, mean ± SD, **p < 0.01 compared with 1:1 cell mixtures). (C) Fluorescence micrograph of frozen sections of a nude mouse lung at 7 h after tail vein injection of red CMRA-labeled HIF-1α siRNA treated MDA-MB-435 cells mixed 1:1 with green CMFDA-labeled normal MDA-MB-435 cells. (D) Tumor cell count ratios (green CMFDA-labeled normal MDA-MB-435 cells/red CMRA-labeled HIF-1α siRNA treated MDA-MB-435 cells) in lung at 15 min and 7 h after tail vein injection (n = 6, mean ± SD, **p < 0.01 compared with 1:1 cell mixtures).

Reprints and Corporate Permissions

Please note: Selecting permissions does not provide access to the full text of the article, please see our help page How do I view content?

To request a reprint or corporate permissions for this article, please click on the relevant link below:

Academic Permissions

Please note: Selecting permissions does not provide access to the full text of the article, please see our help page How do I view content?

Obtain permissions instantly via Rightslink by clicking on the button below:

If you are unable to obtain permissions via Rightslink, please complete and submit this Permissions form. For more information, please visit our Permissions help page.