Figures & data
Figure 1. Participant flow chart.
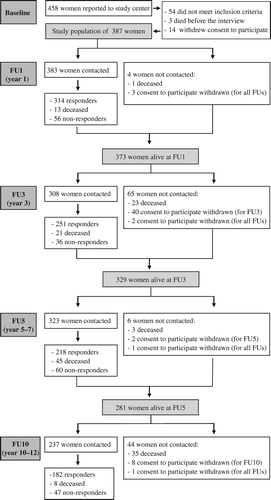
Table I. Characteristics of study population by response statusa.
Figure 2. Age-specific quality of life (means and standard errors) of the QLQ-C30 for survivors 10 years past diagnosis and references. Significant differences (p < 0.05) between survivors and references are indicated by a star.
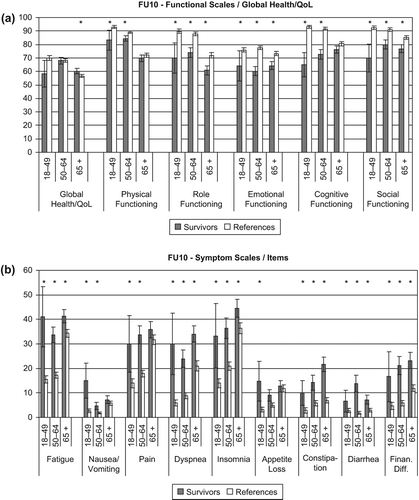
Figure 3. Longitudinal development (means and standard errors) of QLQ-C30 functional scales and global health/QoL for survivors that responded in each follow-up (solid line) and cross-sectional comparisons with references adjusted for age (dots). P-values pertain to differences between survivors and references at each follow-up.
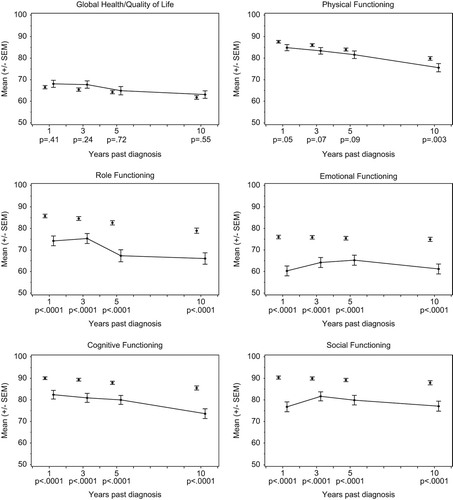
Figure 4. Longitudinal development (means and standard errors) of QLQ-C30 symptom scales and single items for survivors that responded in each follow-up (solid line) and cross-sectional comparisons with references adjusted for age (dots). P-values pertain to differences between survivors and references at each follow-up.
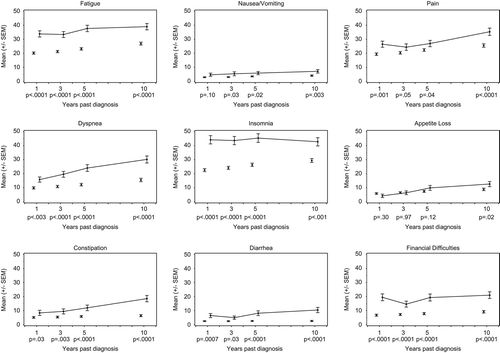
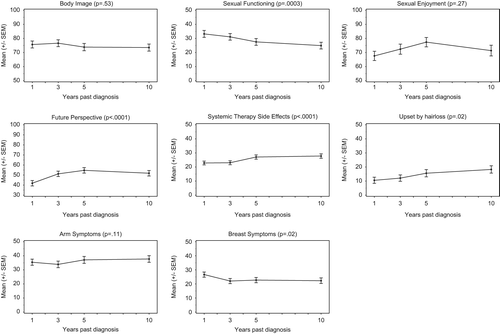
Figure 5. Longitudinal development (means and standard errors) of QLQ-BR23 scales and single items for survivors that responded in each follow-up. P-values pertain to changes in BR23-scores over time.