Figures & data
Figure 1. Schematic of the workflow applied in our study. A. Acquisition of PET images (fused CT for illustrative purposes), followed by tumor delineation. B. Extraction of Radiomics features from the defined volume of interest. C. Test-retest and inter-observer stability analysis.
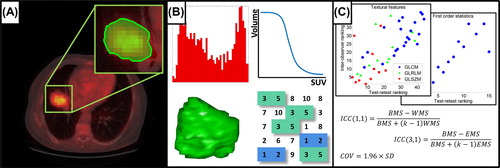
Figure 2. A and B. Representative images of repeated imaging of a patient from the test-retest cohort, with the 50% SUVmax tumor delineation shown outlined in green, for, respectively, the first and second baseline PET scan. C. Representative image of a patient from the inter-observer cohort, where the lesion area is outlined with the green square (fused CT for illustrative purposes). D. Enlargement of the lesion area with in different colors the five independent tumor delineations by multiple observers.
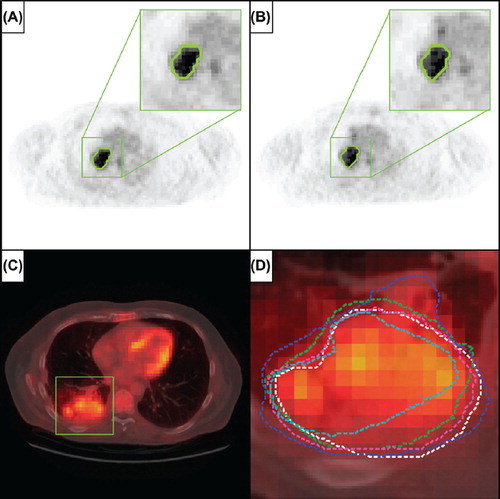
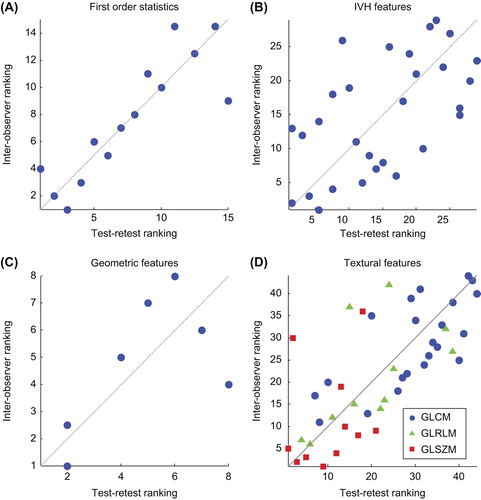
Figure 3. Scatter plots of stability rankings of test-retest versus inter-observer intra-class correlation coefficients. A higher rank corresponds with a higher stability. Plotted diagonal illustrates perfect correlation. A. First order statistics (ρs = 0.877, p << 0.001). B. Intensity volume histogram features (ρs = 0.572, p << 0.001). C. Geometric features (ρs = 0.663, p << 0.086). D. Textural features (ρs = 0.719, p << 0.001), with GLCM features in blue circles, GLRLM features in green triangles and GLSZM features in red squares.