Figures & data
Figure 1. Target definition workflow: parametric images (top) produce respective threshold regions (middle), and clinical margins are applied (bottom). Perfusion is in green, metabolic rate in blue, and overlap in red.
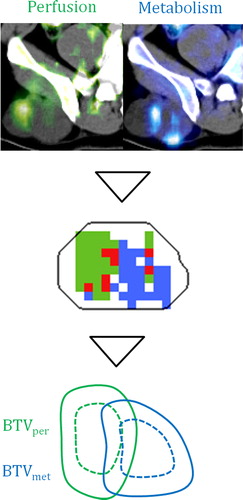
Figure 2. The Dice's similarity coefficient (DSI) between BTVper and BTVmet as a function of the clinical margin for each region.
Table I. Results from the dose planning given as median and range. The p-values results from of a Mann-Whitney test of the dose metrics in BTVper and BTVmet.
Figure 3. The dose distribution in patient 3. BTVper in dark green, BTVmet in purple, and PTV in blue. The 70 Gy isoshade is in red, and the 60 Gy isoshade is in green. Panel A shows an axial image where BTVper is boosted, while BTVmet is boosted in the panel B.
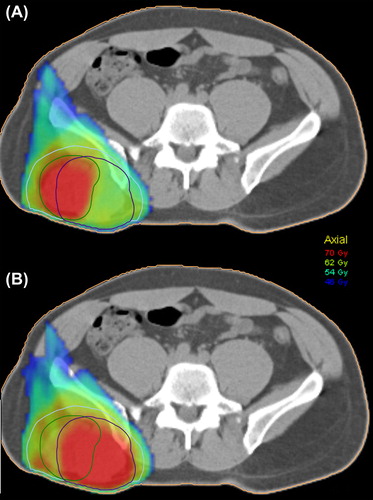
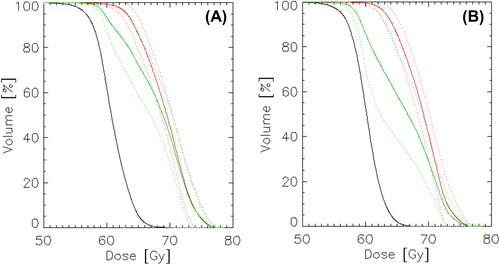
Figure 4. Cohort-based mean dose volume histograms from the two boost regimes, either were BTVmet (A) or BTVper (B) is boosted. PTV in black, BTV used for boosting in red, and corresponding non-boost BTV in green. The dotted lines indicate one standard deviation.