Figures & data
Figure 1. (a) Marker motion relative to the bony anatomy during three cone beam computed tomography fields (CBCT) and five treatment fields (Treat) of a typical treatment fraction (Patient 3). Horizontal lines show the mean (i.e. baseline) position during each field. The inset is an enlargement of the CBCT2 motion. (b) 3D plot of motion during CBCT2. The semi-axes of the ellipsoid, shown to illustrate the directionality, were defined from principal component analysis (PCA). (c) The 3D motion shown in the coordinate system defined by the principal components (PC). The inset-table shows the positional variance along the PCs of the field. (d) Motion during CBCT2 in PC coordinates with detected respiratory inhale peaks along the first PC. (e) A single respiratory cycle (encapsulated by black box in ) during CBCT2 compared with the motion in the planning 4DCT scan. The arrows show the directions of the first and second PCs of these two respiratory cycles, for which the difference in directionality was 5.2°. The inset-table shows the motion explained by the PCs of the respiratory cycles.
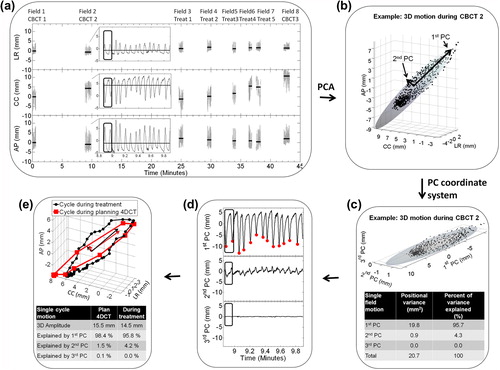
Figure 2. All target positions during a single respiratory cycle, field, fraction, and the full course for Patient 2a shown together with the first principal component (PC) of the motion (black arrow) and the first PC of the motion in the planning 4DCT scan (red arrow). For fractions and courses, the motion data are shown both excluding (top) and including (bottom) intrafraction baseline shifts between fields. The percentage of total motion explained by the cranio-caudal (CC) direction, the first PC of the planning 4DCT scan, and the first PC of the motion itself during treatment is shown below the figures.
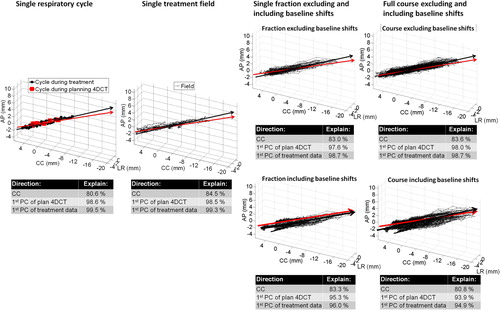
Figure 3. (a) Boxplot of 3D motion amplitude of all individual respiratory cycles during treatment together with motion observed in the 4DCT scans. The boxes show 25%, 50%, and 75% quartiles. Whiskers include the most extreme amplitudes. Seven treatment courses with mean 3D motion exceeding 5 mm (and selected for directionality analysis) are marked with an asterisk. Patient 2a and 2b denote the same patient (re-treated). (b) Mean 3D motion amplitude during treatment as a function of amplitude in the planning 4DCT scan. Error bars represent the standard deviation of individual respiratory cycle amplitudes during treatment. The straight line represents ideal unity correlation.
Table I. Difference (mean ± SD) between mean motion amplitude and directionality during the treatment courses and in the planning and control 4DCT as averaged over all courses.
Figure 4. Directionality of each individual respiratory cycle during treatment (small dots, yellow if 3D cycle amplitude was below 5 mm), during plan 4DCT scanning (big red dots), and during control 4DCT scanning (blue circles) shown in a spherical coordinate system as projected onto a unit sphere viewed from the south-pole. The inclination angle is the inclination relative to pure CC motion (center of sphere).The azimuthal angle describes the direction in the transversal plane, with 0° corresponding to no LR motion. Positions below the center correspond to simultaneous cranial-posterior motion. Large black circular contours represent 5° and 10° angle differences from the mean course directionality (center of the contours) for each patient. The percentage of respiratory cycles within the 10° contour is stated for each patient. (a) Patients with mean 3D motion amplitude exceeding 5 mm. (b) Patients with mean motion amplitude below 5 mm.
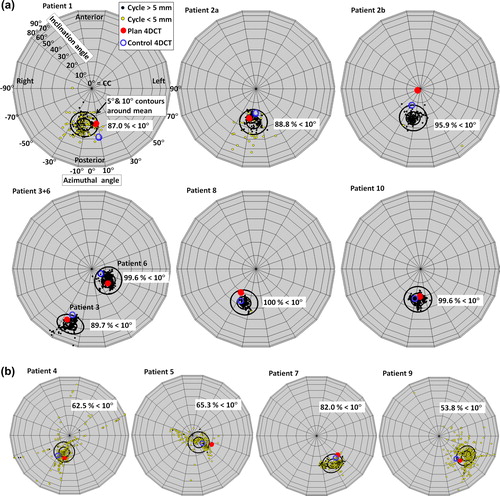
Table II. Percentage of total motion during treatment explained by the CC direction, the direction of the first PC of the planning 4DCT scan, and the first PC of the motion itself during individual respiratory cycles, fields, fractions, and courses as averaged over all patients.