Figures & data
Figure 1. A) Comparison of the bladder volume modeled as an ellipsoid and the true bladder volume in planning CT scans. B) Observed changes of the maximum dimensions of the bladder in cranial-caudal (C-C), anterior-posterior (A-P) and lateral (DX-SIN) directions (open symbols). All observed changes lie under the level of 1.0 cm (dotted line). The theoretical limit for the growth in one dimension (one of C-C, A-P or DX-SIN, others unchanged) is plotted in solid spheres (fit: solid line) and the theoretical growth in three dimensions (all of C-C, A-P and DX-SIN) is plotted with solid squares (fit: dashed line) (Equations 2 and 3).
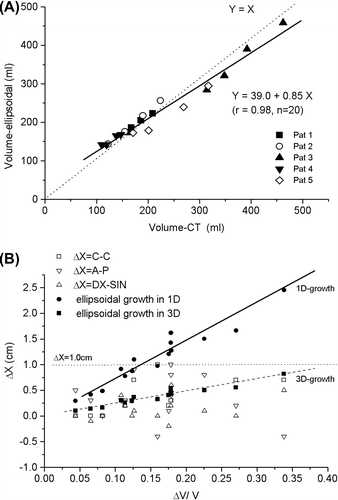
Figure 2. The filling rate of the bladder during the treatment as a function of the filling rate during treatment planning CT (in CT linear filling is assumed).
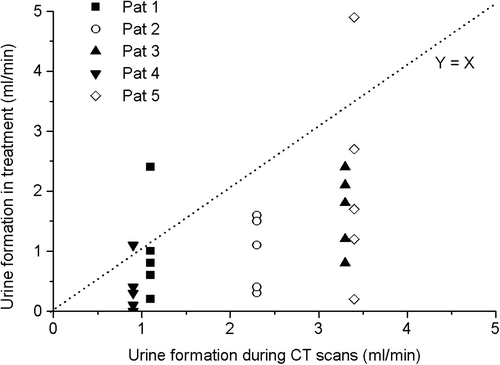
Figure 3. The difference between the irradiated volumes of the bladder with full and empty bladder (ΔV) in partial bladder treatment. Two different dose levels are specified using both relative and absolute volume scale.
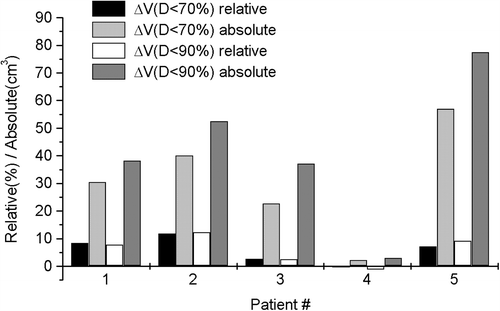
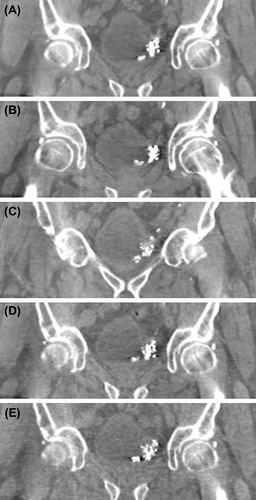
Figure 4. Five coronal views of CBCT images from the same patient using different imaging protocols. The absorbed doses measured in the center of a PMMA phantom (r = 16cm) for the protocols are A) 20.5 mGy B) 11.2 mGy C) 7.5 mGy D) 4.0 mGy and E) 3.0 mGy. A and B are manufacturer protocols and C, D and E are optimized low dose protocols. For this patient the image quality with protocol E was decided sufficient for treatment plan selection.