997
Views
28
CrossRef citations to date
0
Altmetric
Original Articles

Dose/volume-based evaluation of the accuracy of deformable image registration for the rectum and bladder

, , , &
Pages 1411-1416 | Received 03 May 2013, Accepted 03 Jun 2013, Published online: 23 Jul 2013

Figures & data

Table I. The Vmanual and the Vprop volumes [population median (range)]. The p-value refers to a Wilcoxon signed-rank test.

Table II. Patient averages (range), given for one of the quantitative measures (DSC) and the qualitative measure.

Table III. The investigated dose/volume-based measures [population median (range)] assessed for the Vmanual and the Vprop volumes.

Figure 1. The linear correlation between two of the dose/volume-based measures (Rectum: DVHdiff; Bladder: gEUDdiff) and the volume variations related to the DIR quality (|Vprop-Vmanual|/Vmanual) or the actual volume variation (|Vmanual-VpCT|/VpCT) for the rectum (left) and the bladder (right).

Figure 1. The linear correlation between two of the dose/volume-based measures (Rectum: DVHdiff; Bladder: gEUDdiff) and the volume variations related to the DIR quality (|Vprop-Vmanual|/Vmanual) or the actual volume variation (|Vmanual-VpCT|/VpCT) for the rectum (left) and the bladder (right).

Figure 2. An illustration of the association between the quality of the DIR and the resulting differences in the DVH for the bladder. Referring to the upper right plot in , the two patients shown here are the patients with the largest (left), respectively the smallest (right) DIR quality related volume variations (|Vprop-Vmanual|/Vmanual = 0.30 and 0.01, respectively) and gEUDdiff (gEUDdiff = 1.94 and 0.47). For both patients, the scan shown is the scan with values of the DIR quality related volume variations closest to the median.

Figure 2. An illustration of the association between the quality of the DIR and the resulting differences in the DVH for the bladder. Referring to the upper right plot in Figure 1, the two patients shown here are the patients with the largest (left), respectively the smallest (right) DIR quality related volume variations (|Vprop-Vmanual|/Vmanual = 0.30 and 0.01, respectively) and gEUDdiff (gEUDdiff = 1.94 and 0.47). For both patients, the scan shown is the scan with values of the DIR quality related volume variations closest to the median.

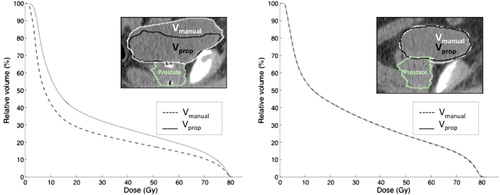
Table IV. Linear correlations (R2) between the dose/volume-based measures and the quantitative and qualitative measures. *p ≤ 0.05.

Reprints and Corporate Permissions

Please note: Selecting permissions does not provide access to the full text of the article, please see our help page How do I view content?

To request a reprint or corporate permissions for this article, please click on the relevant link below:

Academic Permissions

Please note: Selecting permissions does not provide access to the full text of the article, please see our help page How do I view content?

Obtain permissions instantly via Rightslink by clicking on the button below:

If you are unable to obtain permissions via Rightslink, please complete and submit this Permissions form. For more information, please visit our Permissions help page.