Figures & data
Figure 1. A representative example of measured (M) and reconstructed (R) doses for the high modulation volumetric modulated arc therapy (VMAT) lung plan delivered with the high frequency lung motion trajectory. The dose in the central 6 × 6 cm of one of the biplanar arrays is displayed for the first three VMAT sub-arcs (i.e. first three tenths of the VMAT field) as well as accumulated for the entire VMAT field. The three columns show the dose of a static phantom (left), a moving phantom without tracking (middle), and a moving phantom with tracking (right). One diode was broken (marked with a black arrow) and invariably showed zero in the measured dose. The red arrow marks an example of dose redistribution due to interplay effects in this specific VMAT sub-arc.
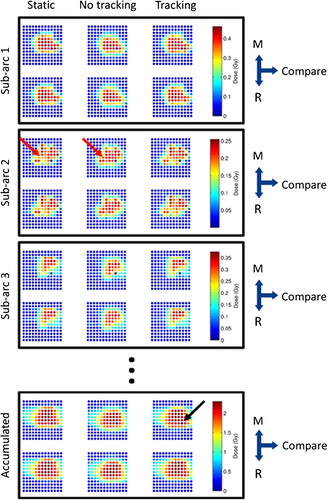
Figure 2. Measured (curves) and reconstructed (symbols) cumulative doses in three sample diodes in the Delta4PT phantom: the diode in the center of the phantom (blue), a diode in a high dose gradient (green), and a diode in the periphery of the phantom (red). Doses are shown for the static phantom (full line) as well as the moving phantom without (dashed line) and with (dotted line) tracking. Top: high and low modulation lung VMAT plans with the high frequency lung tumor motion trajectory. Bottom: high and low modulation prostate VMAT plans with the Continuous drift prostate motion trajectory. The central and peripheral diodes were the same for all plots, whereas the high dose gradient diode differed between lung and prostate VMAT plans.
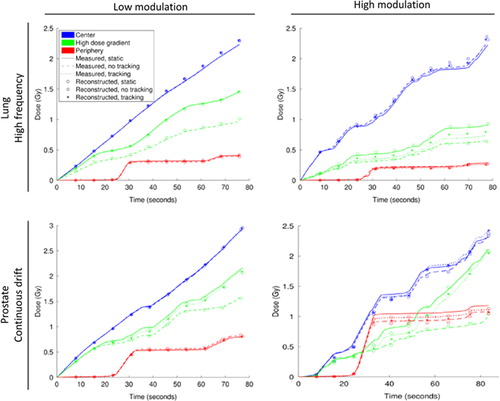
Table I. Results of dose reconstruction quantified by dose differences to the measured dose.
Table II. Results of dose reconstruction quantified by γ-tests using measured dose as reference.
Figure 3. 3%/3 mm γ failure rates in the final accumulated dose delivered to the moving target with (closed symbols) and without (open symbols) dynamic MLC tracking for lung (squares) and prostate (circles) VMAT plans. The reference dose for the γ-test was the dose to the static phantom. The scatter plot compares the γ failure rate in the measured doses with the γ failure rate in the reconstructed doses for the 32 combinations of VMAT treatment plans, motion trajectories, and tracking or no tracking. The line of unity is shown in black.