Figures & data
Figure 1. Eigenvalue spectra for each target. Different colors denote patients with different degrees of movement, light gray for smaller movers and black for larger movers.
Figure 2. Sensitivity as a function of iso-coverage level for a PCA-model based on all DVFs as input (solid line), with six DVFs as input (dashed line), with five DVFs as input (dashed-dotted lines) and with four DVFs as input (dotted lines). The target of CTV-p is in red, CTV-sv (green) and CTV-ln (blue). All data is displayed as average values with ± 1 SD in error bars.
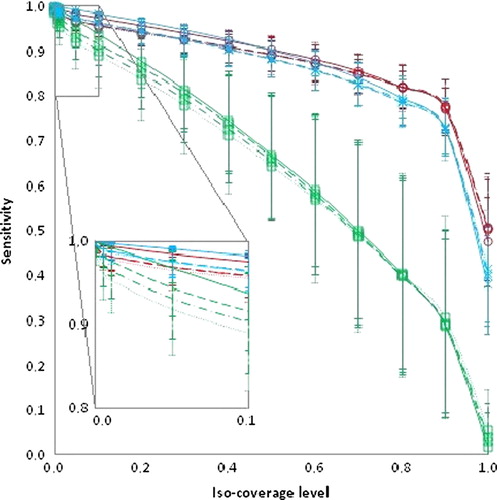
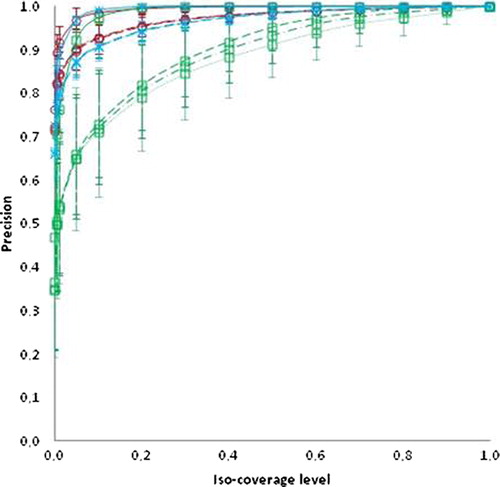
Figure 3. Precision as a function of iso-coverage level for a PCA-model based on all DVFs as input (solid line), with six DVFs as input (dashed line), with five DVFs as input (dashed-dotted lines) and with four DVFs as input (dotted lines). The target of CTV-p is in red, CTV-sv (green) and CTV-ln (blue). All data is displayed as average values with ± 1 SD in error bars.