936
Views
4
CrossRef citations to date
0
Altmetric
Original Articles

Ultra-high field 1H magnetic resonance imaging approaches for acute hypoxia

, , , , &
Pages 1287-1292 | Received 03 Jul 2013, Accepted 09 Jul 2013, Published online: 30 Aug 2013

Figures & data

Figure 1. BOLD MRI parametric maps of T2* mean and SD for a control tumour.

Figure 1. BOLD MRI parametric maps of T2* mean and SD for a control tumour.

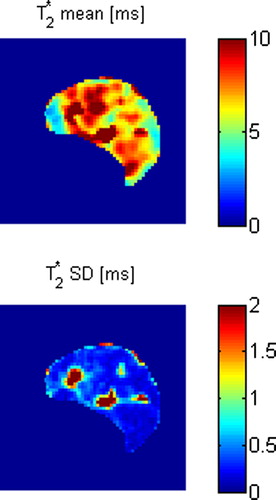
Figure 2. DCE-MRI parametric maps for the same control tumour as shown in . Initial maps and difference maps for the two DCE-MRI scans are shown.

Figure 2. DCE-MRI parametric maps for the same control tumour as shown in Figure 1. Initial maps and difference maps for the two DCE-MRI scans are shown.

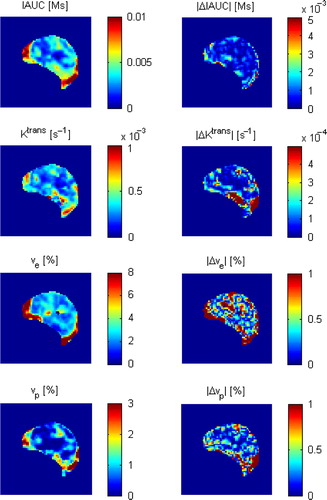
Table I. BOLD MRI parameter values.

Table II. DCE-MRI parameter values.

Reprints and Corporate Permissions

Please note: Selecting permissions does not provide access to the full text of the article, please see our help page How do I view content?

To request a reprint or corporate permissions for this article, please click on the relevant link below:

Academic Permissions

Please note: Selecting permissions does not provide access to the full text of the article, please see our help page How do I view content?

Obtain permissions instantly via Rightslink by clicking on the button below:

If you are unable to obtain permissions via Rightslink, please complete and submit this Permissions form. For more information, please visit our Permissions help page.