Figures & data
Figure 1. Representative histograms showing the oxygen partial pressure (pO2) profiles obtained in C3H mammary carcinomas with the Eppendorf oxygen electrode. Results show the relative frequency of the various pO2 values measured in 3–6 mice under either control or clamped conditions.
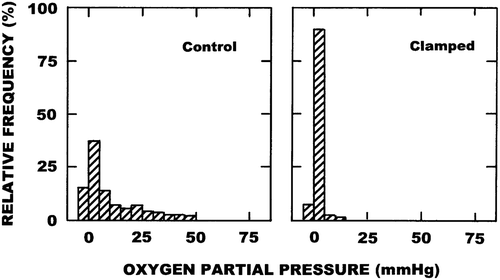
Table I. The effect of VDA treatment on tumour oxygenation.
Figure 2. The effect of VDAs on the radiation response of C3H mammary carcinomas. Left panel top: Tumour growth time (time for tumours to grow to three times treatment volume) following local tumour irradiation. Results are the means (± 1 S.E.) from 6–8 mice per group with the lines fitted following linear regression analysis using individual data points. Right panel top: The percentage local tumour control obtained 90 days after irradiation. Results are from 8–19 mice per group, with the curves fitted following logit analysis. For both figures the results are for radiation alone (○) or radiation followed by an injection with OXi4503 (50 mg/kg) two hours later (●). Bottom panel: Enhancement ratios (ER; ratio of the effect of radiation alone and radiation plus VDA) as a function of varying the time interval and schedule between radiation and VDA treatment. These ERs were calculated from the data shown in the top panels, plus similar unpublished and published data [Citation23–26]. Radiation was always given at time zero and no enhancement of radiation response is represented by an ER of 1.0. Points are for FAA (▲), DMXAA (∆), CA4P (○), and OXi4503 (●).
![Figure 2. The effect of VDAs on the radiation response of C3H mammary carcinomas. Left panel top: Tumour growth time (time for tumours to grow to three times treatment volume) following local tumour irradiation. Results are the means (± 1 S.E.) from 6–8 mice per group with the lines fitted following linear regression analysis using individual data points. Right panel top: The percentage local tumour control obtained 90 days after irradiation. Results are from 8–19 mice per group, with the curves fitted following logit analysis. For both figures the results are for radiation alone (○) or radiation followed by an injection with OXi4503 (50 mg/kg) two hours later (●). Bottom panel: Enhancement ratios (ER; ratio of the effect of radiation alone and radiation plus VDA) as a function of varying the time interval and schedule between radiation and VDA treatment. These ERs were calculated from the data shown in the top panels, plus similar unpublished and published data [Citation23–26]. Radiation was always given at time zero and no enhancement of radiation response is represented by an ER of 1.0. Points are for FAA (▲), DMXAA (∆), CA4P (○), and OXi4503 (●).](/cms/asset/8df5e952-8b1e-43b3-8a51-19401dad97bc/ionc_a_825050_f0002_b.gif)
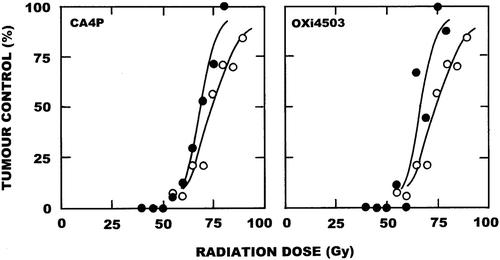
Figure 3. The effect of VDAs on the response of the C3H mammary carcinoma when irradiated in a fractionated schedule of 10 fractions in 12 days. Local tumour control was determined 90 days after completion of irradiation. Results are from an average of 18 mice per group, with the curves fitted following logit analysis. For both figures the results are for radiation alone (○) or radiation followed by an injection with the VDA one hour after radiation fractions number 5 and 10 (●); the VDAs being either CA4P (250 mg/kg; left panel) or OXi4503 (50 mg/kg; right panel).