Figures & data
Figure 1. Impact of the estimated tumor control probability (TCP) on the survival curve. The TCP affects the LYL of late complications because these are competing risks – a poor long-term survival means less risk of experiencing a late event. This example shows the difference in estimated overall survival for males and females for a TCP of either 80% or 60%.
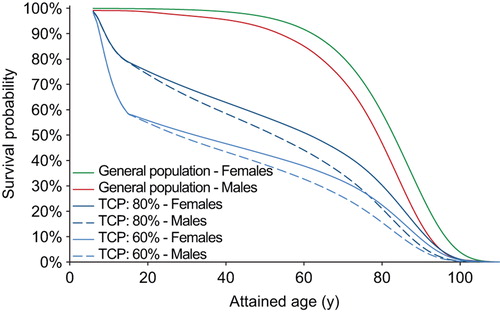
Figure 2. The estimated risk of dying from failure to control the primary disease using our presented mathematical framework is shown to increase until about 10 years after diagnosis. The graphs compare four different levels of tumor control probability represented by the five-year freedom from progression.
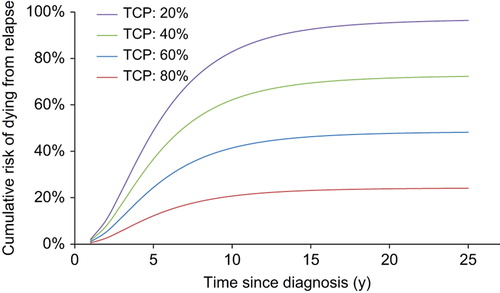
Figure 3. Number of life years lost (LYL) attributable to various late complications and failure to control the primary disease for two different prescription strategies. Even though the primary disease dominates the LYL there is an estimated gain if lowering the dose to the Th1–Th10 part of the craniospinal target. In the right hand panel, the anatomical position of the heart, lungs, thyroid, mammary glands and stomach are shown in relation to the craniospinal target (in cyan).
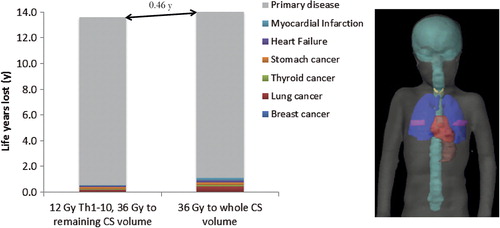
Figure 4. Estimated total number of life years lost if altering the prescription dose to (a) the whole craniospinal target volume or (b) Th1–Th10. Here (b) corresponds to treatment strategy 2 in the text. Confidence limits are based on Monte Carlo sampling of the dose-response parameters for late complications and tumor control.
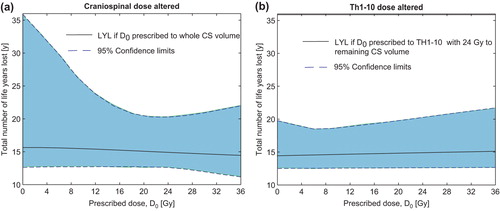
Figure 5. Separation of the life years lost (LYL) attributable to late complications and failure to control the primary disease. Here, the dose to the spinal canal is altered (treatment strategy 3) while a dose of 24 Gy is maintained to the remaining CS volume. Confidence limits are based on Monte Carlo sampling of the dose-response parameters for late complications and tumor control. Note that failure to control the primary tumor dominates the total LYL for these patients.
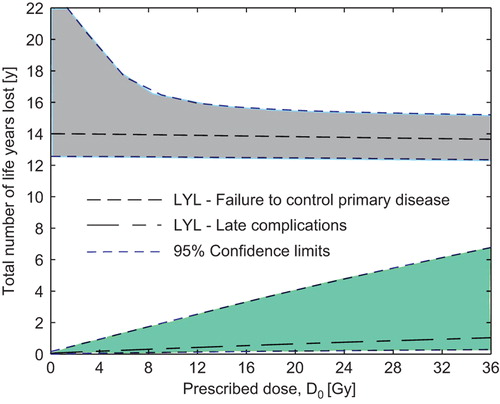
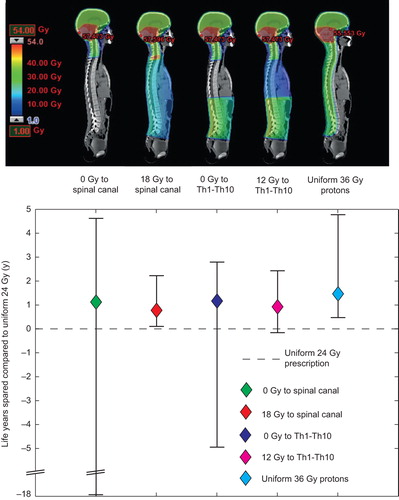
Figure 6. Differences in total life years lost (LYL) between the standard uniform 24 Gy treatment and risk-adapted strategies. For all risk-adaptive strategies, 36 Gy is prescribed to the remaining craniospinal volume. Accompanying illustrations of the different treatment strategies are shown in dose color-wash. A positive LYL difference means fewer LYL with the risk-adapted approach. The vertical bars show the 95% confidence intervals of the LYL differences.