1,869
Views
42
CrossRef citations to date
0
Altmetric
Paediatric Oncology

Proton beam therapy reduces the incidence of acute haematological and gastrointestinal toxicities associated with craniospinal irradiation in pediatric brain tumors

, , , , , , , , , & show all
Pages 1158-1164 | Received 15 Oct 2013, Accepted 18 Jan 2014, Published online: 10 Mar 2014

Figures & data

Table I. Patient characteristics.

Figure 1. Representative examples of dose distribution for the craniospinal irradiation method. (A) Sagittal view (left: proton beam therapy; right: photon beam therapy). (B) Axial view (top: proton beam therapy, bottom: photon beam therapy). (C) Dose-volume histograms for the brain and spinal planning target volumes, and of specific tissues of interest (solid line: proton beam therapy, dashed line: photon beam therapy). PTV, planning target volume.

Figure 1. Representative examples of dose distribution for the craniospinal irradiation method. (A) Sagittal view (left: proton beam therapy; right: photon beam therapy). (B) Axial view (top: proton beam therapy, bottom: photon beam therapy). (C) Dose-volume histograms for the brain and spinal planning target volumes, and of specific tissues of interest (solid line: proton beam therapy, dashed line: photon beam therapy). PTV, planning target volume.

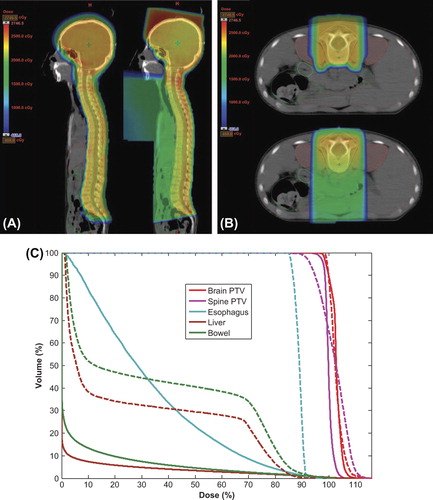
Table II. Acute toxicities.

Figure 2. (A,B) Changes in thrombopoietin levels (A) and platelet counts (B) during craniospinal irradiation. (C,D) Changes in thrombopoietin (C) and platelet counts (D) in five patients who did not undergo chemotherapy after craniospinal irradiation. Values in A and B are means with 95% confidence intervals. Values in C and D are the actual values in each patient.

Figure 2. (A,B) Changes in thrombopoietin levels (A) and platelet counts (B) during craniospinal irradiation. (C,D) Changes in thrombopoietin (C) and platelet counts (D) in five patients who did not undergo chemotherapy after craniospinal irradiation. Values in A and B are means with 95% confidence intervals. Values in C and D are the actual values in each patient.

Table III. Changes in haematological parameters from before starting CSI to 1 month after treatment.

Reprints and Corporate Permissions

Please note: Selecting permissions does not provide access to the full text of the article, please see our help page How do I view content?

To request a reprint or corporate permissions for this article, please click on the relevant link below:

Academic Permissions

Please note: Selecting permissions does not provide access to the full text of the article, please see our help page How do I view content?

Obtain permissions instantly via Rightslink by clicking on the button below:

If you are unable to obtain permissions via Rightslink, please complete and submit this Permissions form. For more information, please visit our Permissions help page.