1,670
Views
50
CrossRef citations to date
0
Altmetric
Radiotherapy

Differences in respiratory-induced pancreatic tumor motion between 4D treatment planning CT and daily cone beam CT, measured using intratumoral fiducials

, , , , , , & show all
Pages 1257-1264 | Received 20 Dec 2013, Accepted 10 Mar 2014, Published online: 23 Apr 2014

Figures & data

Figure 1. Sum of pixel values over the ROI divided by the mean sum over all gantry angles (a, b) and the same signal after filtering out the change in attenuation and cardiac motion (c, d). The values on the vertical axes are given in arbitrary units (a.u.).

Figure 1. Sum of pixel values over the ROI divided by the mean sum over all gantry angles (a, b) and the same signal after filtering out the change in attenuation and cardiac motion (c, d). The values on the vertical axes are given in arbitrary units (a.u.).

Figure 2. 4DCT (red solid lines) and CBCT data (boxplots) of respiratory-induced fiducial marker motion magnitude (MM) in (a) superior-inferior, (b) anterior-posterior and (c) left-right direction.

Figure 2. 4DCT (red solid lines) and CBCT data (boxplots) of respiratory-induced fiducial marker motion magnitude (MM) in (a) superior-inferior, (b) anterior-posterior and (c) left-right direction.

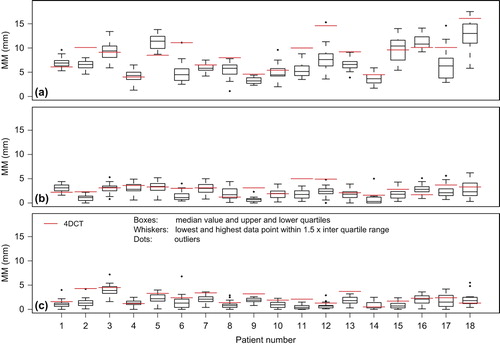
Table I. Tumor motion in superior-inferior direction, comparing 4DCT with daily CBCT.

Figure 3. Marker motion in the superior-inferior direction during a CBCT, for 3 fractions (a–c). Circles indicate projections selected by the program to make end-inhale (open) and end-exhale (closed) phase reconstructions.

Figure 3. Marker motion in the superior-inferior direction during a CBCT, for 3 fractions (a–c). Circles indicate projections selected by the program to make end-inhale (open) and end-exhale (closed) phase reconstructions.

Figure 4. MMCBCT values (closed symbols) in superior-inferior direction for patients 8 (a) and 15 (b), plotted as function of treatment day (day 0 is the day of planning CT). Lines are linear fits to the MMCBCT data; slopes (mm/day) are indicated in the legends (*p < 0.05; **p < 0.01; ***p < 0.001). MM4DCT values (open symbols) were not included in the fit.

Figure 4. MMCBCT values (closed symbols) in superior-inferior direction for patients 8 (a) and 15 (b), plotted as function of treatment day (day 0 is the day of planning CT). Lines are linear fits to the MMCBCT data; slopes (mm/day) are indicated in the legends (*p < 0.05; **p < 0.01; ***p < 0.001). MM4DCT values (open symbols) were not included in the fit.
Supplemental material

Supplementary Figures B1–B3

Download PDF (2.6 MB)

Reprints and Corporate Permissions

Please note: Selecting permissions does not provide access to the full text of the article, please see our help page How do I view content?

To request a reprint or corporate permissions for this article, please click on the relevant link below:

Academic Permissions

Please note: Selecting permissions does not provide access to the full text of the article, please see our help page How do I view content?

Obtain permissions instantly via Rightslink by clicking on the button below:

If you are unable to obtain permissions via Rightslink, please complete and submit this Permissions form. For more information, please visit our Permissions help page.