1,330
Views
21
CrossRef citations to date
0
Altmetric
Colorectal cancer

Dose-response of acute urinary toxicity of long-course preoperative chemoradiotherapy for rectal cancer

, , &
Pages 179-186 | Received 06 Dec 2013, Accepted 06 May 2014, Published online: 30 Jun 2014

Figures & data

Table I. Patient and treatment characteristics.

Figure 1. Relationship between relative volume of the bladder receiving at least 35 Gy (V35Gy) and the risk of grade 1 or above (thin line, blue) or grade 2 and above (thick line, green) acute urinary toxicity. Data points represent observed toxicity (with 68% confidence intervals), fitted lines represent fit to the logistic model (Equation 1). A) Dose-response taking only the dose metric, and no additional risk factors, into account. B) Dose-response for patients with the highest risk (male patients receiving a brachy therapy boost, dashed line/triangles), and dose-response for patients with the lowest risk (female, no brachytherapy, full line/diamonds). The fit to the logistic model takes V35Gy, gender and brachytherapy (as a binary variable) into account.

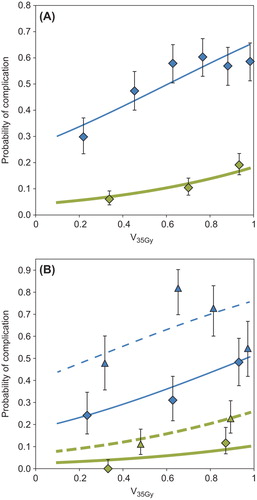
Table II. Model fit quality for different dose metrics.

Table III. Ordinal logistic model fits for dose cut-off model.

Figure 2. Plot of predicted versus observed toxicity, illustrating the model calibration. Patients have been grouped by increasing risk, as predicted by a logistic model including V35Gy, gender and brachytherapy dose. Blue diamonds (upper 6 points): Grade 1 and above cystitis. Green diamonds (lower 6 points): Grade 2 and above cystitis. Lack of calibration is indicated by deviance from the identity line (dotted line). Error bars show 68% confidence intervals.
Figure 3. Model fit quality of Vx model for all dose levels (x), estimated by the log likelihood divided by the number of patients in the model fit. Higher values indicate better fit to the clinical data. Black line: All patients in cohort. Dashed, blue line: Patients treated with 3D conformal (3D-CRT) treatment plans. Dotted, green line: Patients treated with intensity-modulated radiotherapy (IMRT) treatment plans.
Figure 4. Optimal dose cut-off model for acute toxicity for patients treated with A) intensity-modulated radiotherapy (IMRT, V18Gy), B) 3D conformal radiotherapy (3D-CRT, V50Gy), and C) the total patient cohort (V35Gy). Figure A) and B) additionally show the observed response for the other patient group [3D-CRT in A) and IMRT in B)]. Figure C) shows observed response for all patients (solid diamonds: 3D-CRT, empty diamonds: IMRT). Thin, blue lines and diamonds: Risk of grade 1 or above acute cystitis. Thick, green lines and diamonds: Risk of grade 2 and above acute cystitis. Uncertainty bars indicate 68% confidence levels.
Supplemental material

ionc_a_923933_sm8214.pdf

Download PDF (297 KB)

Reprints and Corporate Permissions

Please note: Selecting permissions does not provide access to the full text of the article, please see our help page How do I view content?

To request a reprint or corporate permissions for this article, please click on the relevant link below:

Academic Permissions

Please note: Selecting permissions does not provide access to the full text of the article, please see our help page How do I view content?

Obtain permissions instantly via Rightslink by clicking on the button below:

If you are unable to obtain permissions via Rightslink, please complete and submit this Permissions form. For more information, please visit our Permissions help page.