Figures & data
Figure 1. Metabolic characterization of SiHa WT and MD cells. (A) Oxygen consumption rates (OCR) expressed as oxygen-sensitive probe fluorescence decay (lifetime in μs)/minute were measured in the absence or presence of antimycin (2.5 μM) a mitochondrial complex III inhibitor. ***, p < 0.001 ANOVA1 (n = 4). (B) Extracellular acidification rates (ECAR) expressed as pH-sensitive probe fluorescence decay (lifetime in μs)/minute were measured in the absence or presence of antimycin (2.5 μM). ***, p < 0.001 ANOVA1 (n = 4). (C, D) Extracellular glucose and lactate concentrations were determined enzymatically in the culture media and expressed as a delta metabolite concentration after 24 hours of culture and after normalization to protein content. *, p < 0.05 and **, p < 0.01 ANOVA2 and Bonferroni post-test (n = 3).
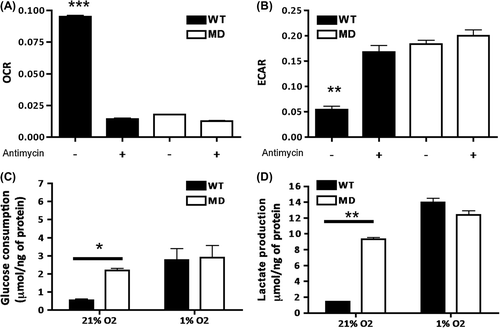
Figure 2. In vivo characterization and micro regional differences of hypoxia distribution in WT and MD tumors. (A, B) Quantification of hypoxic and necrotic fraction for both groups after staining of WT and MD tumor sections with hypoxyprobe. © Zonal analysis of pimonidazole intensities as a function of distance from the nearest total blood vessel. Each point represents the median pimonidazole intensity within a selected zone for at least four different areas/tumor (n = 3). ***, p < 0.001 ANOVA2 for hypoxia.
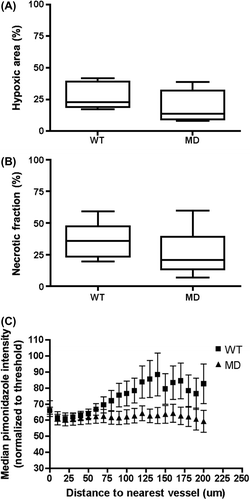
Figure 3. Growth delay after irradiation of WT and MD tumors. (A) Kaplan-Meier survival curves were obtained by introducing individual dates for reaching mean tumor diameter of 16 mm, determined as endpoint (n = 4–5).
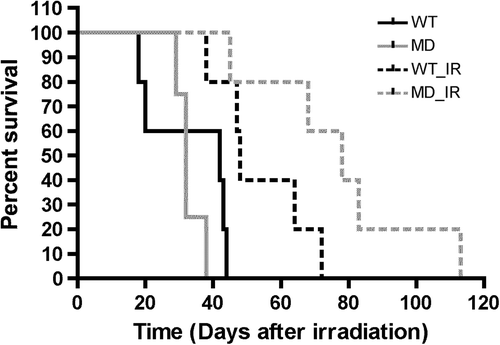
Figure 4. Assessment of response to irradiation of WT and MD cells in vitro. (A) Survival curves after irradiation of WT and MD cells in normoxia (plain curves) and hypoxia (dashed curves). (B) DNA damage repair after a single dose irradiation (5 Gy) expressed relative to the maximum (1 hour post-irradiation) (n = 3).
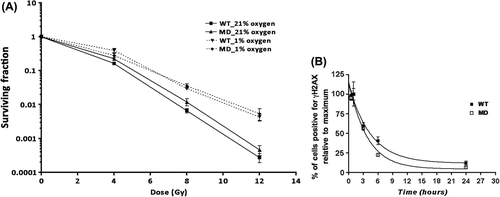
Table I. Analysis of cell cycle distribution in WT and MD after irradiation (5 Gy).
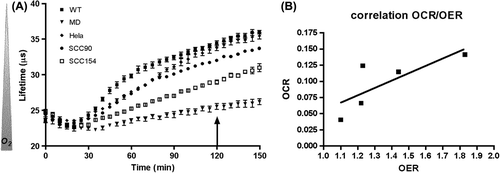
Figure 5. Oxygen consumption and radioresistance of WT, MD, Hela, SCC90 and SCC154 cell lines. (A) Oxygen consumption measured by fluorometry. The oxygen-sensitive probe fluorescence decay (lifetime in μs) is inversely correlated to oxygen concentration in the wells. The arrow illustrates the time point at which cells were irradiated (0–2–4 Gy). (B) Oxygen enhancement ratio (OER) was calculated as the ratio between survival fraction for hypoxic cells (closed wells)/aerobic cells (open wells) through a linear quadratic model and was then correlated to oxygen consumption rate (OCR). Spearman's correlation coefficient = 0.77.