1,699
Views
46
CrossRef citations to date
0
Altmetric
ORIGINAL ARTICLE

Combined T2w volumetry, DW-MRI and DCE-MRI for response assessment after neo-adjuvant chemoradiation in locally advanced rectal cancer

, , &
Pages 1729-1736 | Received 12 Jan 2015, Accepted 26 Mar 2015, Published online: 27 Apr 2015

Figures & data

Figure 1. cT3N2 rectal adenocarcinoma in a 60-year-old male patient. T2-weighted imaging (a), Ktrans map (b), b800 image (c) and apparent diffusion coefficient map (d).

Figure 1. cT3N2 rectal adenocarcinoma in a 60-year-old male patient. T2-weighted imaging (a), Ktrans map (b), b800 image (c) and apparent diffusion coefficient map (d).

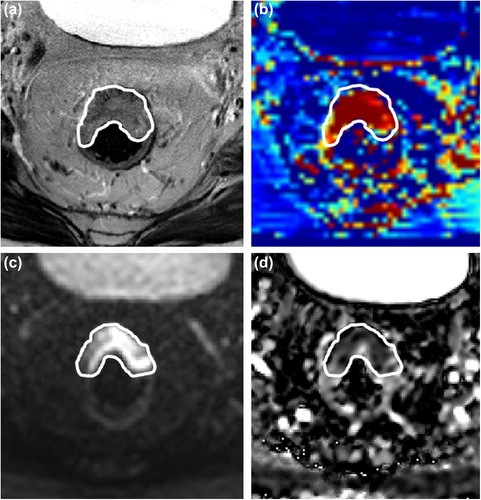
Table I. Comparison of response groups.

Table II. Classification tables for the diagnosis of pathological complete response (pCR).

Table III. Classification tables for the diagnosis of pathological good response (GR).

Figure 2. Calibration plots for the best discriminative models for pathological complete response (pCR, a) and pathological good response (GR, b). On the x-axis the true probability of favorable response is shown and on the y-axis the predicted probability. The patient group was divided in three subgroups based on the observed probability. The dashed line shows a perfect calibration. ADC, apparent diffusion coefficient.
Figure 3. ROC curves for the individual response parameters (a and c) and the multiparameter models (b and d) for pathological complete response (pCR, a and b) and pathological good response (GR, c and d).

Reprints and Corporate Permissions

Please note: Selecting permissions does not provide access to the full text of the article, please see our help page How do I view content?

To request a reprint or corporate permissions for this article, please click on the relevant link below:

Academic Permissions

Please note: Selecting permissions does not provide access to the full text of the article, please see our help page How do I view content?

Obtain permissions instantly via Rightslink by clicking on the button below:

If you are unable to obtain permissions via Rightslink, please complete and submit this Permissions form. For more information, please visit our Permissions help page.