1,834
Views
35
CrossRef citations to date
0
Altmetric
ORIGINAL ARTICLE

Relative biological effectiveness of carbon ions for tumor control, acute skin damage and late radiation-induced fibrosis in a mouse model

, , , , , , & show all
Pages 1623-1630 | Received 02 Jun 2015, Accepted 01 Jul 2015, Published online: 14 Aug 2015

Figures & data

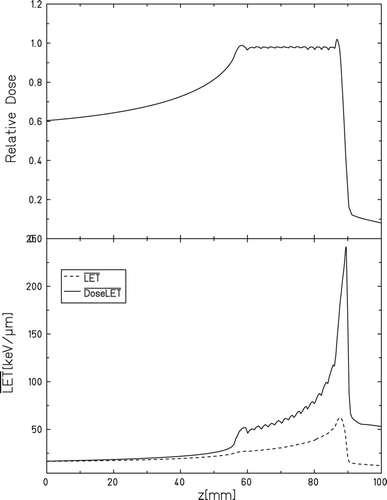
Figure 1. Depth dose profile of carbon ions. The relative dose (upper panel) and the LET (lower panel) as a function of depth. The target region is placed 0.5–1.5 cm from the proximal edge of the 3 cm SOBP (red lines indicates SOBP margins). Dose average LET in the target: ∼65 keV/μm.

Figure 2. Tumor control. Effect of carbon ion irradiation on the radiation response of a C3H mouse mammary carcinoma. A: Tumor response was assessed by the percentage of mice showing local tumor control 90 days after treatment. The points represent results from an average of 5 or 6 mice per group and the errors (bars) show 95% confidence intervals on the TCD50 values, p < 0.0005. B: Tumor growth time of carbon ion irradiated tumors. For controls and 10–20 Gy (●) the results show means from an average of 5–9 mice per group. The curves are terminated when the first animals in the group had to be euthanized. Errors bars represents standard error (n = 5–9). For 30 Gy and 35 Gy (○) data from single tumors without local control is shown. Selected doses are shown for clarity. C: Tumor growth time of photon irradiated tumors. Results show means from an average of 5–9 mice per group. The curves are terminated when the first animals in the group had to be euthanized. Errors-bars represents standard error (n = 5–9).
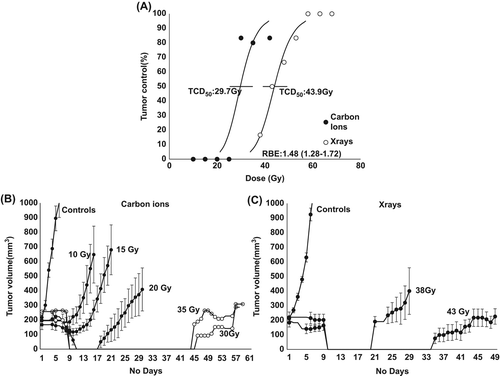
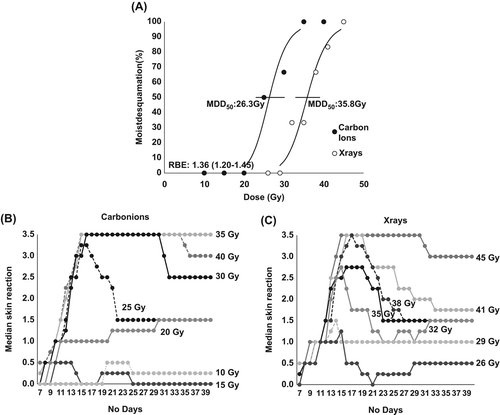
Figure 2. Tumor control. Effect of carbon ion irradiation on the radiation response of a C3H mouse mammary carcinoma. A: Tumor response was assessed by the percentage of mice showing local tumor control 90 days after treatment. The points represent results from an average of 5 or 6 mice per group and the errors (bars) show 95% confidence intervals on the TCD50 values, p < 0.0005. B: Tumor growth time of carbon ion irradiated tumors. For controls and 10–20 Gy (●) the results show means from an average of 5–9 mice per group. The curves are terminated when the first animals in the group had to be euthanized. Errors bars represents standard error (n = 5–9). For 30 Gy and 35 Gy (○) data from single tumors without local control is shown. Selected doses are shown for clarity. C: Tumor growth time of photon irradiated tumors. Results show means from an average of 5–9 mice per group. The curves are terminated when the first animals in the group had to be euthanized. Errors-bars represents standard error (n = 5–9).
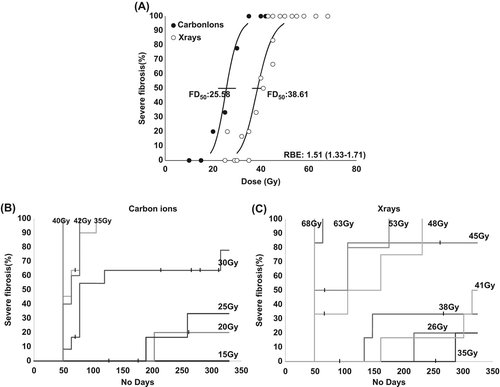
Figure 3. Acute skin score. Effect of carbon ion or photon irradiation on the radiation response of normal mouse foot skin. A: Tissue response was assessed by the percentage of mice showing moist desquamation between 7 and 40 days after treatment. Points, results from an average of six mice per group; and the errors (bars) show 95% confidence intervals on the MDD50 values, p < 0.0005 B/C: Skin reactions as a function of time after graded doses of carbon ion (B) or (C) photon radiation. For each dose, the points represent the median value of the skin reactions in groups of six mice on the specified days.
Figure 4. Late radiation-induced fibrosis. Effect of carbon ion or photon irradiation on dose-dependence of radiation-induced fibrosis. A: Tissue response was assessed by the percentage of mice showing severe fibrosis between 49 and 322 days after treatment. Points: results from an average of 5–11 mice per group; and the errors (bars) show 95% confidence intervals on the MDD50 values, p < 0.0005. B/C: Kaplan-Meier plot of the development of severe fibrosis, measured by the leg contracture model after graded doses of carbon ion (B) or (C) photon radiation. Each group contains 6–11 animals.

Reprints and Corporate Permissions

Please note: Selecting permissions does not provide access to the full text of the article, please see our help page How do I view content?

To request a reprint or corporate permissions for this article, please click on the relevant link below:

Academic Permissions

Please note: Selecting permissions does not provide access to the full text of the article, please see our help page How do I view content?

Obtain permissions instantly via Rightslink by clicking on the button below:

If you are unable to obtain permissions via Rightslink, please complete and submit this Permissions form. For more information, please visit our Permissions help page.