Figures & data
Table I. Patient characteristics.
Figure 1. Example of a patient showing increased lung density in the post-treatment scans inside the irradiated area. The pre-treatment scan and follow-up scan are shown. The yellow contours represent the planning target volume (PTV). Patient shows a severe change in density. The mean density change is 108 HU. The bottom plot shows the average increase for the various dose bins for this patient, error-bars represent standard error of the mean (SEM). For illustration purposes, the results are binned into 10 Gy bins.
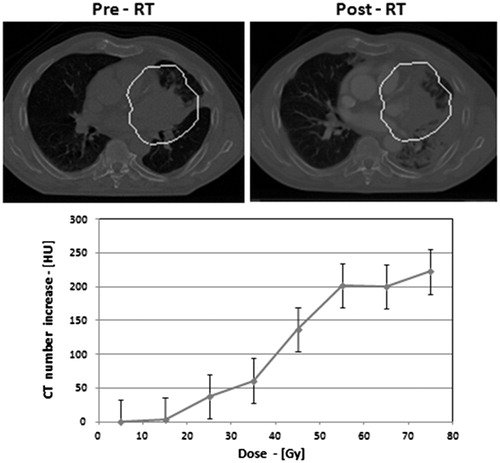
Figure 2. The linear mixed model showed a linear increase of density changes as a function of dose for all treatment groups. The higher increase in density changes was observed in the group treated with cetuximab.
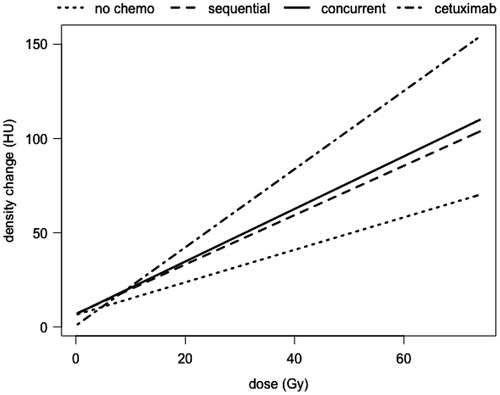
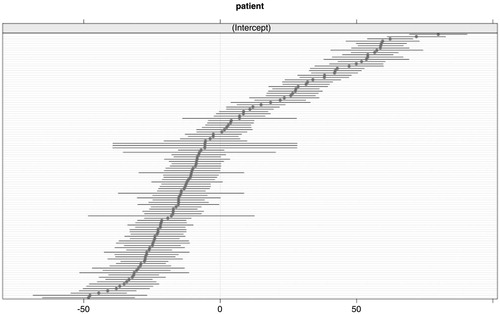
Figure 3. The plot shows the patient-specific random intercepts and the 95% confidence intervals around the patient random intercept. If these intercepts are around zero, it means that the density change could be modeled by just using fixed effects. So, in other words, the patient-specific effect is negligible.