Figures & data
Figure 1. Coating of pancreatic islets with MSCs. Human islets were coated with CellTracked MSCs (green). A: Dose-dependent coating of islets with 100,000, 250,000, or 500,000 MSCs after 48 hours of culture. B: The initial adherence and the following spreading of MSCs after 1, 5, 48, and 96 hours of culture. One representative experiment is shown. C: MSCs within the islet core after 48 hours of co-culture, nuclei in blue. Scale bars = 100 μm.
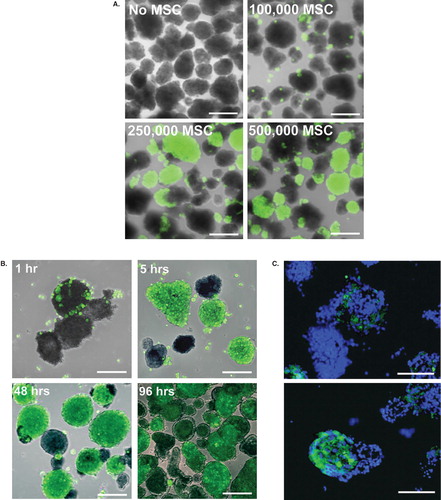
Figure 2. Insulin secretion and expression in MSC-coated islets. A: Insulin secretion was measured in a dynamic perifusion system (n = 5) where control islets (black diamonds) or composite MSC–islets (light triangles) were initially challenged with low-glucose (1.67 mmol/L) followed by high-glucose stimulation (20 mmol/L, 42–78 min). B: The ratio of insulin versus total DNA (pmol × L−1 × ng−1) in islet homogenates (n = 3). C: Insulin-containing cells survived in vivo, indicated by insulin-staining of grafts of human islets and MSC–islets transplanted under the kidney capsule of nude mice retrieved after 2 weeks (n = 3).
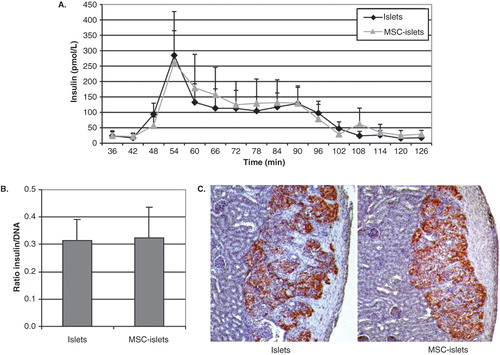
Figure 3. Syngeneic transplantation of mouse MSC–islets. A: Control mouse islets (*) and mouse MSC–islets (**) were transplanted under the kidney capsule of mice and retrieved after 28 days in vivo, showing enlargement of the MSC–islet graft (**) in comparison to control islet graft (*) (n = 3). B: Close up of the MSC–islet graft. C: Section of mouse MSC–islet grafts after decalcification showing bone formation of differentiated MSCs. Bar = 100 μm.
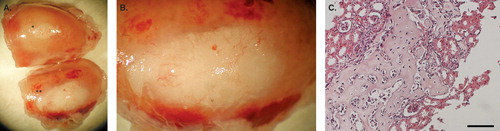
Figure 4. MSCs suppressed lymphocyte proliferation against dissociated islets in MLIR. In one-way proliferative assays between PBMCs and pancreatic islet single cells (A+Ix), the addition of 10% (dark grey bars) and 1% MSCs (light grey bars) significantly suppressed proliferation, compared to the positive control without MSCs (black bars). The relative inhibition was similar to the control where the lymphocytes reacted against allogeneic irradiated lymphocytes (A+Bx). The figure shows an average of six different islets/PBMC/MSC donor combinations (***P < 0.001; *P < 0.05).
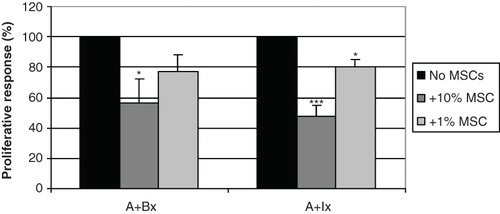
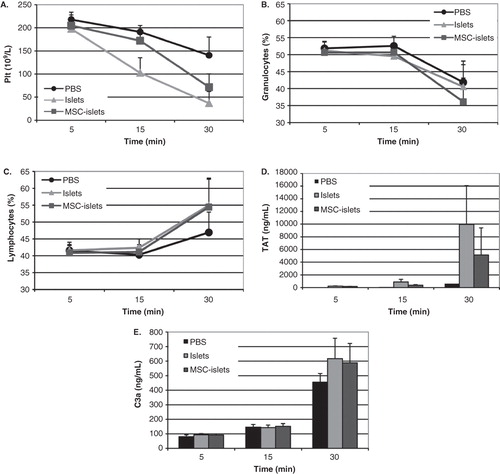
Figure 5. Blood interactions in vitro of control islets and MSC–islets. Control islets (light grey) and human MSC–islets (dark grey) were exposed to human ABO-compatible blood in the tubing blood loop model, and PBS (black) was used as control. Platelet counts (A) and granulocytes (B) decreased, whereas lymphocytes (C) increased. There was no statistically significant difference between control islets and composite grafts. Activation of coagulation was investigated by measurements of thrombin anti-thrombin (TAT) levels, which increased after 30 minutes of incubation in both control islets and MSC–islets compared to PBS (D). Complement activation was triggered in all three groups, shown by increased levels of C3a (E).