Figures & data
Table I. Base-line values of body weight, mean arterial blood pressure (MAP), renal blood flow (RBF), renal vascular resistance (RVR), and heart rate (HR) in CT, DNX, L, DNX-L, CV, DNX-CV, LCV, and DNX-LCV. All data are expressed as mean ± SEM.
Figure 1. Time course of the renal vasoconstrictor response to Ang II. MAP changes (top) and RBF response (bottom) following the administration of a bolus injection (20 ng) into the renal artery. The delay of about 30 s at the beginning of the response is due to the travel time in the cannula before reaching the renal vasculature. Stippled lines denote ± SEM, n = 5 rats.
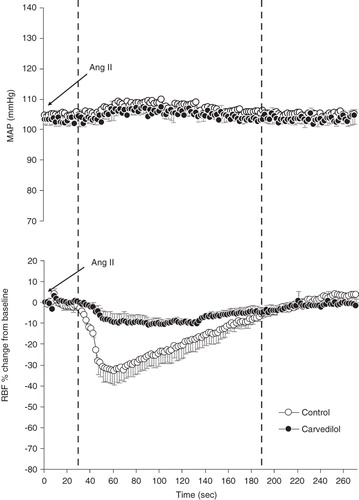
Figure 2. Renal vasoconstrictor responses to graded doses of NA in CT, DNX, L, DNX-L, CV, DNX-CV, LCV, and DNX-LCV. *P < 0.05 compared to CT. # P < 0.05 compared to DNX. Data were analysed by two-way ANOVA followed by Bonferroni post-hoc test, n = 6 rats.
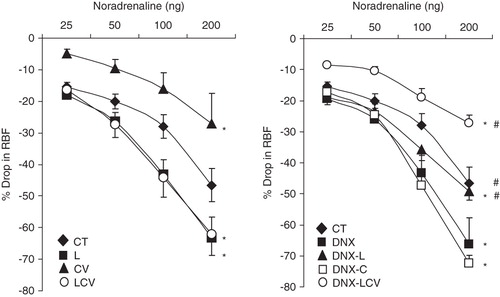
Figure 3. Renal vasoconstrictor responses to graded doses of ME in CT, DNX, L, DNX-L, CV, DNX-CV, LCV, and DNX-LCV. *P < 0.05 compared to CT. # P < 0.05 compared to DNX. Data were analysed by two-way ANOVA followed by Bonferroni post-hoc test, n = 6 rats.
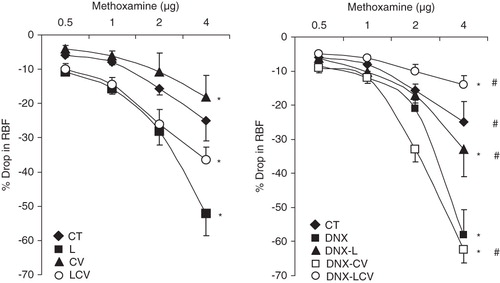
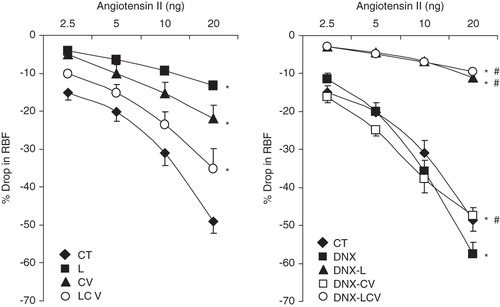
Figure 4. Renal vasoconstrictor responses to graded doses of Ang II in CT, DNX, L, DNX-L, CV, DNX-CV, LCV, and DNX-LCV. *P < 0.05 compared to CT. # P < 0.05 compared to DNX. Data were analysed by two-way ANOVA followed by Bonferroni post-hoc test, n = 6 rats.