643
Views
15
CrossRef citations to date
0
Altmetric
Original Article

Longitudinal trends in laboratory test utilization at a large tertiary care university hospital in Sweden

&
Pages 34-38 | Received 20 Sep 2010, Accepted 22 Sep 2010, Published online: 11 Nov 2010

Figures & data

Table I. Investigated variables and their inflation-adjusted values presented in 2008 euros.

Figure 1. The total number of performed tests per year during the study period.

Figure 1. The total number of performed tests per year during the study period.

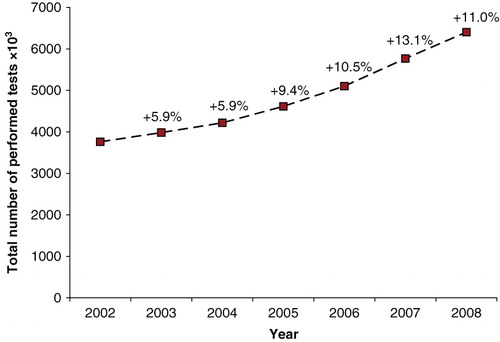
Table II. The percentage of the total number of tests represented by the 10, 20, and 30 most commonly ordered tests.