Figures & data
Table I. Summary of content of the multimodal behavior treatment program.
Figure 1. Diagram of the study design with group sizes and drop-outs (MBT = multimodal behavior treatment; Q = questionnaires; R = randomization; CD = compact disc).
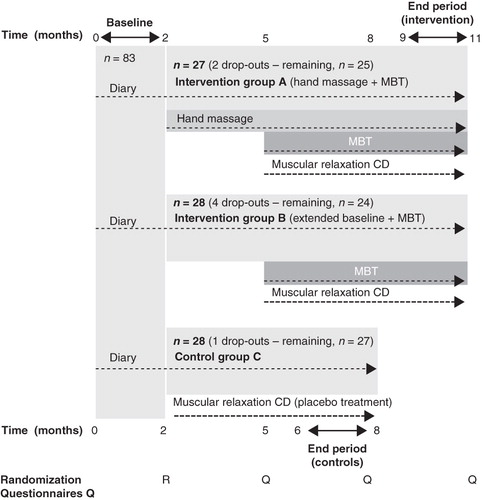
Table II. Demographic profiles and migraine characteristics of participants in intervention groups A and B and in control group C.
Figure 2. Change in migraine frequency between base-line and end period registrations. Box plot diagrams show median value, interquartile range, and full range of number of days with migraine during the first (base-line period) and the last (end period) 56 days of the study for the respective study groups. Outliers are represented by circles and personal codes.
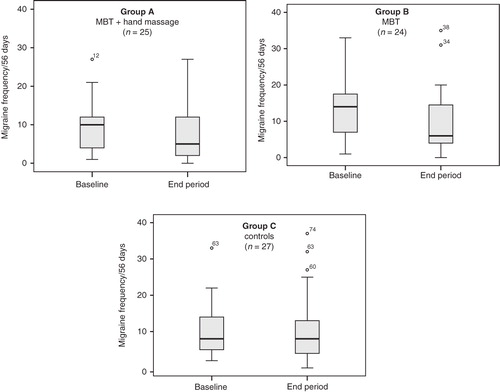
Figure 3. Relative change in migraine frequency between base-line and end period registrations. Individual changes, measured as the percentage decrease or increase of migraine frequency during end period registration compared to the base-line period, are shown in order of magnitude for the respective study groups. Horizontal lines define our main outcome measure: 50%, or more, decreased migraine frequency.
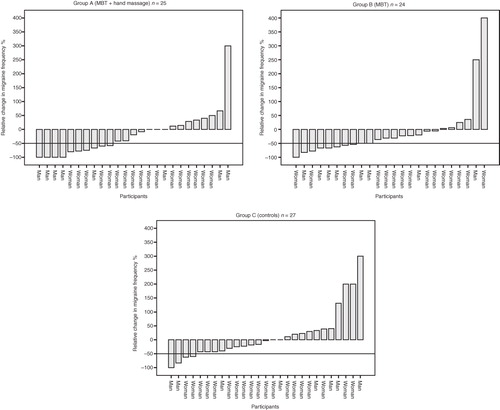
Table III. Main outcome and interactions. A multivariate analysis was performed based on the main outcome variable, a 50% or greater decrease in migraine frequency. Tested main factors were: study intervention and gender. Base-line migraine frequency and change in physical activity between the base-line period and the end period were tested as covariates. Interactions between gender and these other variables were also tested.
Figure 4. Early evaluation of hand massage efficacy in alleviating migraine. The changes in number of days with migraine between the first and the last 4 weeks of an initial 3-month period of hand massage (study group A) versus no treatment (study group B) are shown separately by use of box plot diagrams showing median value, interquartile range, and full range of these changes. Mann–Whitney U-test was used for statistical comparison between the groups.
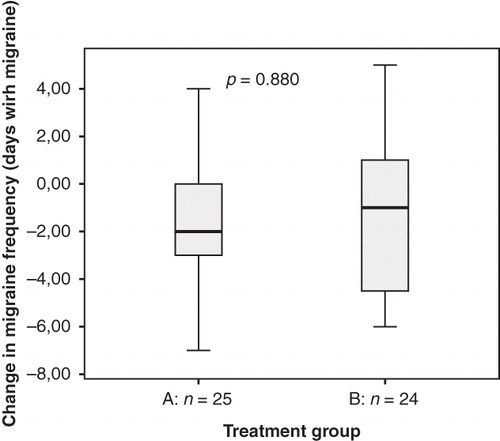
Figure 5. Self-reported compliance of hand massage. Forty sessions were recommended as indicated by the line.
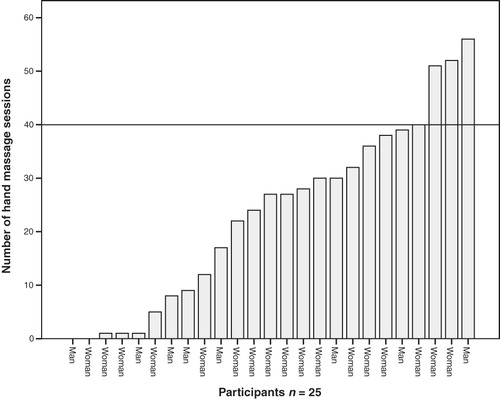
Table IV. Average scores and standard deviations for depression (MADRS-S scale). Comparisons according to the two-way repeated measures analyses of variance (ANOVA), including analyses of interaction effects, between intervention group A, intervention group B, and control group C.
Table V. Average scores and standard deviations for quality of life (PQ23 scale). Comparisons according to the two-way repeated measures analyses of variance (ANOVA), including analyses of interaction effects, between interventions group A, intervention group B, and control group C.
Table VI. Selected quotations of answers to the question ‘Which element(s) in the entire MBT program do you personally consider the most valuable?’ grouped according to the result of a content analysis.