Figures & data
Figure 1. Experimental protocol.
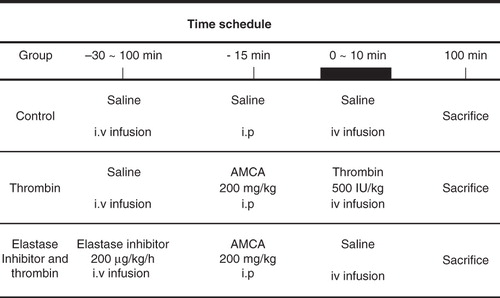
Table I. Effect of a leukocyte elastase inhibitor on wet weight to dry weight (WW/DW) ratio, relative lung water content, and concentration of HA in lung tissue and plasma and bronchoalveolar lavage fluid in rats with thrombin-induced pulmonary edema.
Figure 2. A: Staining of lung sections with biotin-avidin-hyaluronan-binding protein in a control rat. The red area represents hyaluronan-specific staining. The arrow indicates the intense staining of the perivascular and peribronchiolar space. The section was counterstained with hematoxylin (×140). B: Staining of lung sections with biotin-avidin-hyaluronan-binding protein in a representative rat with thrombin-induced pulmonary injury. The red area represents hyaluronan-specific staining. The arrow indicates the weaker staining of hyaluronan in the perivascular and peribronchiolar space. The section was counterstained with hematoxylin (×140). (PA = pulmonary artery; Br = bronchus.)
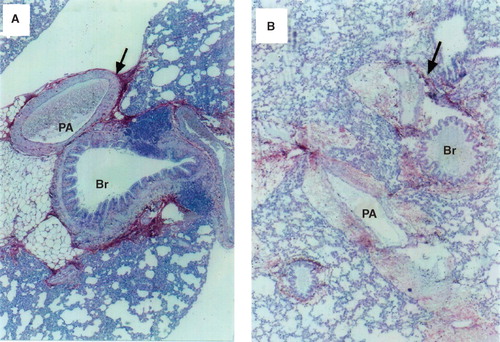
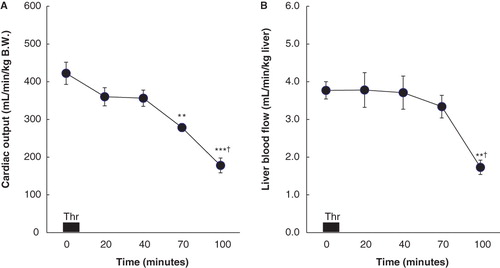
Figure 3. A: Cardiac output (CO; mL/min/kg B.W.) before (0) and 10, 30, 60, and 90 min after the end of thrombin (Thr) infusion in six rats with thrombin-induced pulmonary injury. Data are expressed as mean ± SEM. Baseline (0 min) represents steady-state values before thrombin infusion. ** P < 0.01 compared to the baseline values in CO. *** P < 0.001 compared to the baseline values in CO. † P < 0.05 compared to CO measured at 60 min after thrombin infusion. B: Liver blood flow (LBF; mL/min/kg liver) before (0) and 10, 30, 60, and 90 min after the end of thrombin (Thr) infusion in eight rats with thrombin-induced pulmonary injury. Data are expressed as mean ± SEM. Baseline (0 min) represents steady-state values before thrombin infusion. ** P < 0.01 compared to the baseline values in LBF. † P < 0.05 compared to LBF measured at 60 min after thrombin infusion.