Figures & data
Table I. The CXP arranged extracted data into nine tables that correspond to the nine modules in the original EMR. Data in the top eight tables are extracted from structural data, whereas “Terminology” is extracted from narrative data.
Figure 1. Flow chart for the procedure of selecting personal identification numbers (PIN) to assess the congruity of CXP extracted data to the original EMRs. In step B, the PIN already selected in step A was excluded. In step C, PINs from step A and step B were excluded. Altogether 3,045 data items were compared.
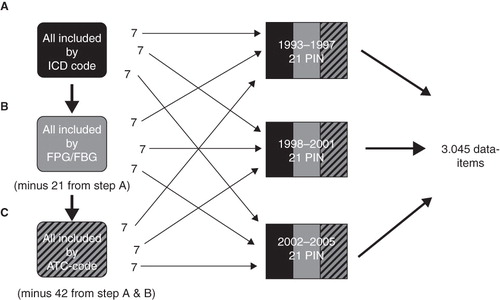
Figure 2. Venn diagrams for data extraction by CXP and by eXtractor, illustrating distribution of inclusion criteria (ICD-10 code, ATC code, laboratory value) for each patient. Patients extracted by Pygargus CXP (n = 445) and by eXtractor (n = 433).
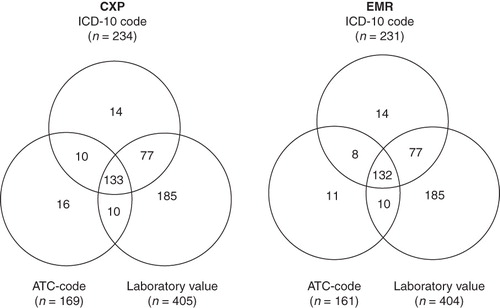
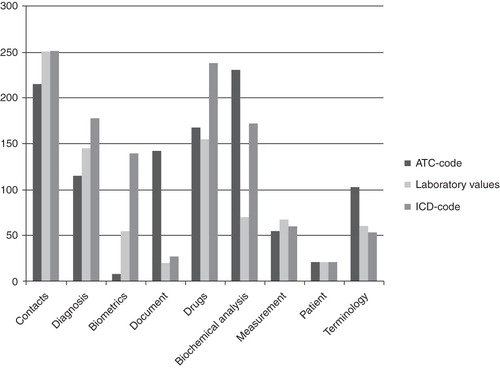
Figure 3. Data items (n = 3,045) compared to the original EMR distributed over nine CXP modules and by inclusion (ATC code, laboratory values, or ICD code).