Figures & data
Figure 1. Expression of fibroblast markers in 6-week-old MMTV-PyMT mice. Representative immunostaining of hyperplastic lesions of a 6-week-old MMTV-PyMT mouse showing the expression pattern of ASMA (A), PDGFRα (B), and FSP1 (C). Scale bar is indicated in the figure and represents 50 µm.
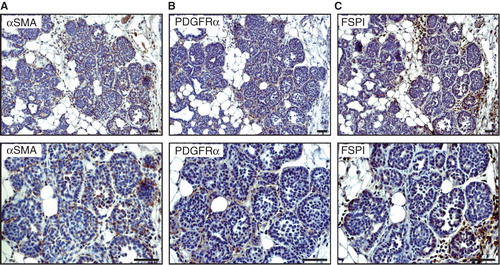
Figure 2. Expression of fibroblast markers in 14-week-old MMTV-PyMT mice. Representative immunostaining of tumour tissue from a 14-week-old MMTV-PyMT mouse showing the expression pattern of ASMA (A), PDGFRα (B), and FSP1 (C). The staining pattern for ASMA and PDGFRα shows similar staining pattern where staining of spindle-shaped stromal cells could be seen. For FSP1 not only stromal streaks were stained but also some cells intermingled in the epithelial islets. Scale bar is indicated in the figure and represents 50 µm.
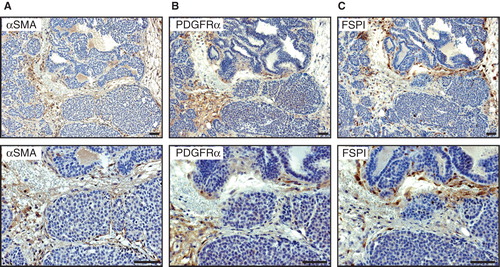
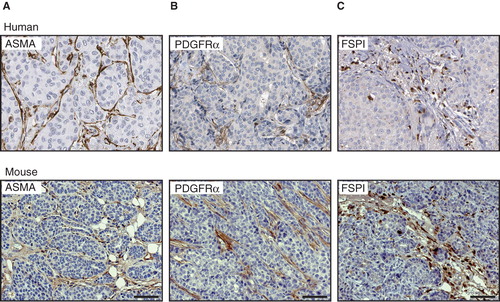
Figure 3. Correlation between CAF markers in mouse and human breast cancer. Immunostainings for ASMA (A), PDGFRα (B), and FSP1 (C), show a similar expression pattern in human (upper panel) and mouse (lower panel) mammary tumour tissue. Scale bar is indicated in the figure and represents 50 µm.