Figures & data
Figure 1. Relationship of the ratios between the GFR estimates produced by the different cystatin C- and creatinine-derived equations with the creatinine production rate (CPR).
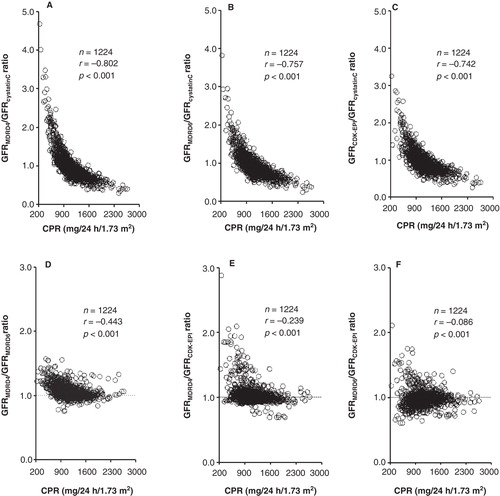
Table I. Creatinine production rate (CPR) and glomerular filtration rate (GFR) estimates from serum cystatin C and creatinine in the groups of controls (C), patients with renal failure (RF), renal transplant (RTx), heart failure (HF), biliary obstruction (BO), liver transplant (LTx), and critical illness (CI).
Figure 2. Correlation and linear regression (A, C, E) and Eksborg difference plots (B, D, F) between the GFR estimates from cystatin C and creatinine in patients with impaired creatinine production (CPR < 900 mg/24 h/1.73 m2). The dotted lines in the difference plots correspond to the proposed difference limits (≤ 40%) between GFR estimates from cystatin C and creatinine for its combined use as arithmetic mean (3).
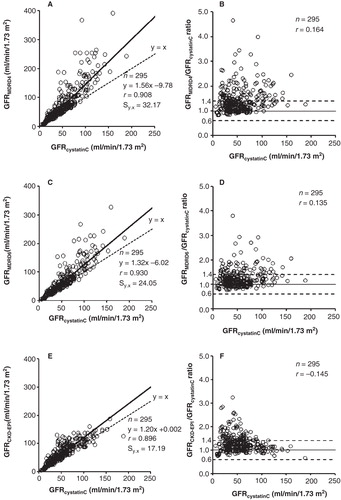
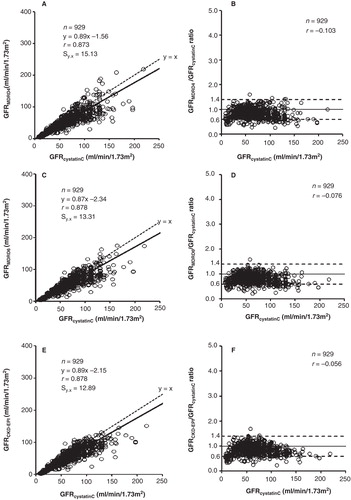
Figure 3. Correlation and linear regression (A, C, E) and Eksborg difference plots (B, D, F) between the GFR estimates from cystatin C and creatinine in patients with maintained creatinine production (CPR > 900 mg/24 h/1.73 m2). The dotted lines in the difference plots correspond to the proposed difference limits (≤ 40%) between GFR estimates from cystatin C and creatinine for its combined use as arithmetic mean (3).