Figures & data
Figure 1. Flow chart displaying the number of participants in the screening process from dental care (DC) to the follow-up in primary health care (PHC).
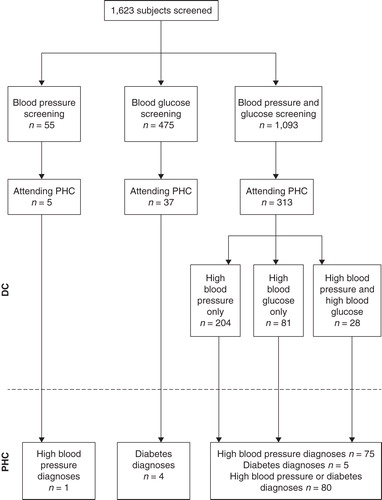
Table I. Financial characteristics. All costs are given in euros.
Table II. Resource use in terms of time (minutes) and costs (€) in blood pressure and blood glucose screening.
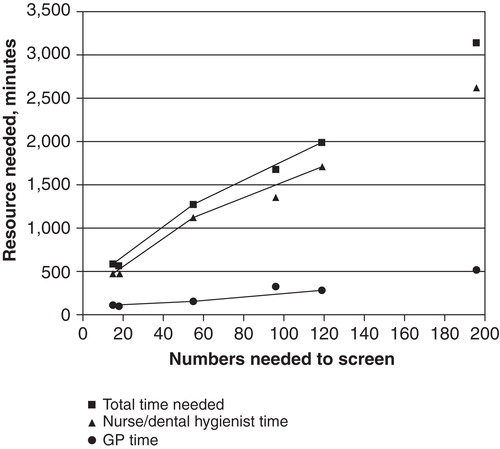
Figure 2. Relationship between numbers needed to screen (NNS) to find one case ending up with a diagnosis, and resources needed in the form of nurse/dental hygienist time, GP time, and total nurse-dental hygienist-GP time. Solid lines indicate results based on screening for blood pressure only, blood glucose only, or combined screening. Symbols with no line indicate results based on other subgroups (cf. ).