Figures & data
Figure 1. Blood glucose concentrations in anesthetized, islet-transplanted (Tx) Wistar-Furth rats, 1 or 9 months after transplantation. Ctr represents age-matched, non-transplanted rats. Samples were taken after surgical preparation (black bars) or 3 min after an intravenous injection of 1 ml 30% D-glucose (grey bars). Values are means ± SEM for 5–9 experiments. *P < 0.001 when compared to the corresponding basal value (Student's unpaired t test); § P < 0.05 versus other glucose-stimulated groups as calculated with ANOVA.
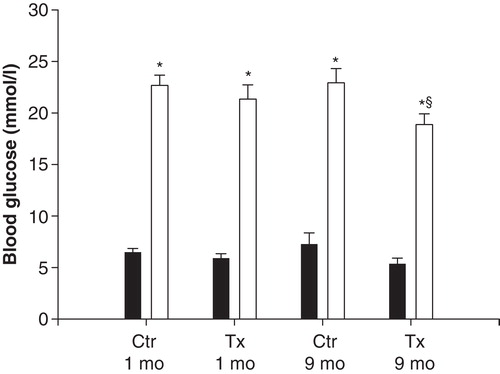
Figure 2. Light micrographs of islet transplants under the renal capsule 1 month (A) and 8 months (B) after transplantation. The sections were immunohistochemically stained for the presence of PGP 9.5 and counterstained with hematoxylin. A neuron (arrow) can be seen in A, and a blood vessel with positive nerves in the adventitia in B. Scale bar 100 µm in A and 200 µm in B.
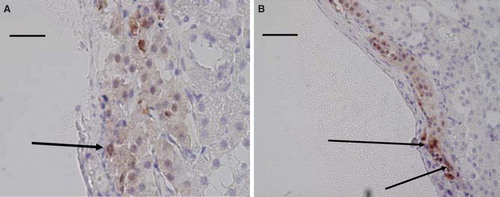
Figure 3. Left kidney blood flow measured, after surgical preparation, with an ultrasound flow probe in anesthetized, islet-transplanted (Tx) Wistar-Furth rats, 1 or 9 months after transplantation. Ctr represents age-matched, non-transplanted rats. Values are means ± SEM for 5–9 experiments. *P < 0.05 when compared to the other groups as calculated with ANOVA.
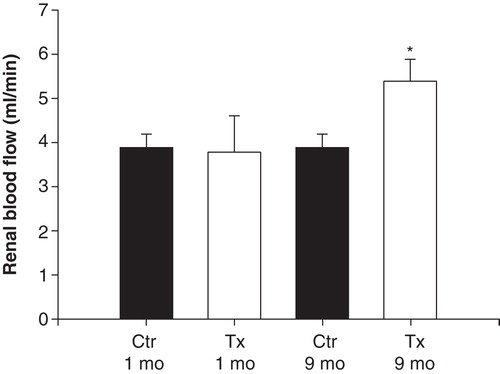
Figure 4. Renal blood flow as a fraction of renal basal blood flow (given as 100% at 1, 3, 5, and 7; for absolute values, see ) during the three nerve stimulations (at 2, 4, and 6) in islet-transplanted rats (grey dots) and non-transplanted control rats (black dots), 1 month (A) or 9 months (B) after transplantation. Values are means ± SEM for 5–9 experiments. See ‘Materials and methods' for further details.
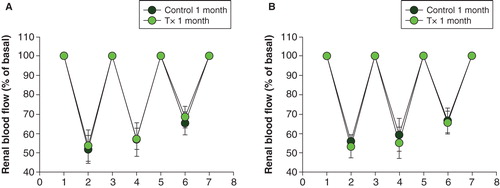
Figure 5. Ratio between serum insulin concentrations in samples from the left renal vein and femoral artery during basal conditions (black bars) and 3 min after an intravenous injection of 1 ml 30% D-glucose (grey bars) in transplanted (Tx) and non-transplanted control (Ctr) rats, 1 or 9 months after transplantation. Values are means ± SEM for 5–9 experiments. *P < 0.05; **P < 0.01 when compared to the corresponding basal value (Student's unpaired t test).
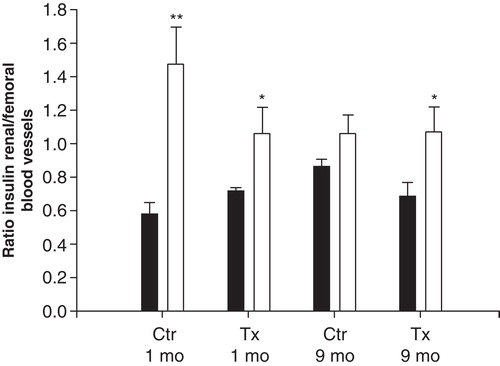
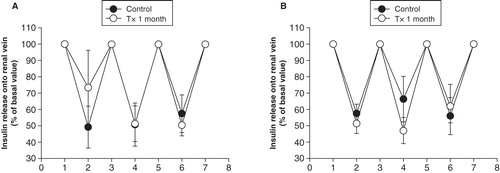
Figure 6. Ratio of serum insulin concentrations in samples from the renal vein and femoral artery during the three nerve stimulations (at 2, 4, and 6) in transplanted (grey dots) and non-transplanted control (black dots) rats, 1 (A) or 9 months (B) after transplantation. The value at basal conditions (1, 3, 5, and 7) is normalized to 1 (for absolute values see ). Values are means ± SEM for 5–9 experiments. See ‘Materials and methods' for further details.
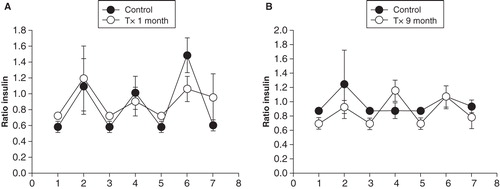
Figure 7. Total amount of insulin released into the left renal vein in transplanted (grey bars) and non-transplanted control (black bars) rats, 1 month or 9 months after transplantation during basal conditions (A) and 3 min after an intravenous injection of 1 ml 30% D-glucose (B). Values are means ± SEM for 5–9 experiments.
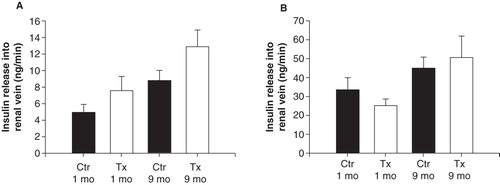
Figure 8. Total amount of insulin released into the left renal vein during the three nerve stimulations in transplanted (grey dots) and non-transplanted control (black dots) rats, 1 month (A) or 9 months (B) after transplantation. The value at basal conditions is normalized to 100% (for absolute values see ). Values are means ± SEM for 5–9 experiments.