Figures & data
Table I. Patient profile, U22, and SF-36 in 105 ablated patients.
Table II. Singular and repeated ablations.
Figure 1. Symptomatic improvement in 105 patients and freedom from subsequent reablation. Survival curves for freedom from reablation as a function of days after first-time ablation. The population was dichotomized into two subsets along the median of individual patients' differences in U22 scores, computed as (scorefollow-up – scorebaseline). The plot is shown for the U22 score q11 (effect of arrhythmia on the well-being), p < 0.0001 for the difference between the survival curves. A similar pattern was seen in the U22 scores q01, q12, and time-aspect of arrhythmia (p = 0.0006, p < 0.0001, and p < 0.0001, respectively).
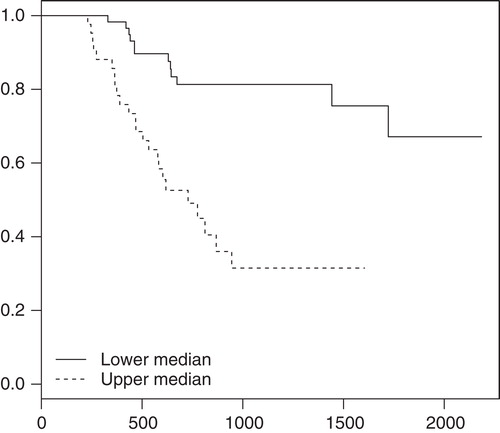
Figure 2. Differences in U22 scores in singular ablations compared to the first of multiple ablations. The differences for q01, q11, q12, and time-aspect in individual patients were computed as (scorefollow-up – scorebaseline). Singular ablations are represented by white boxes, the first of multiple ablations by grey boxes. The boxes are delimited by mean ± 1 SD. The central line depicts the mean, and the whiskers are placed at the extreme values. For all scores the singular ablations resulted in significantly larger improvements than the first of multiple ablations.
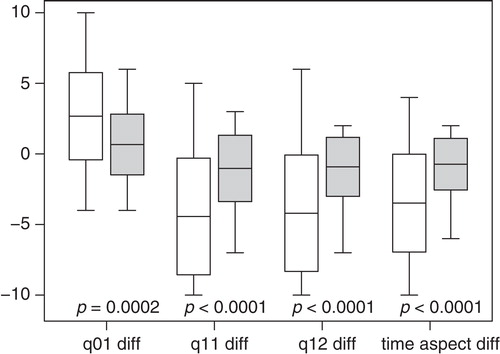
Table III. Estimation of internal consistency of the U22 scores in 105 first-time procedures.