Figures & data
Figure 1. Study design description. The figure shows the design for a participant who started with the exercise period (when read from left to right). The subjects were randomized to whether they started with exercise or with the period of little physical activity. During the exercise period participants were randomized to consume blueberries on exercise days, or to be asked not to make any changes in regular eating habits. Blood sampling was performed in the fasting state in the morning; running-races at maximal speed were performed in the evening at 6 p.m.
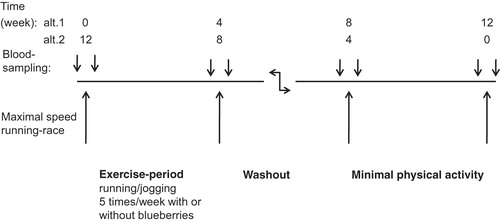
Table I. Anthropometrics, laboratory variables, and body fat content during the trial in the mixed population, i.e. without separate analysis depending on whether blueberries were consumed or not, n = 26. All laboratory variables, except S-CK and hs-CRP, were the mean of the analyses before and after the 5 km race that was performed at the beginning and at the end of both trial periods, i.e. the period of exercise or the period of minimal physical activity. There were no differences between the groups at baseline, i.e. baseline of exercise compared with baseline of exercise periods. P values correspond to Student's paired 2-tailed t test. The delta value is the level of a measurement at the end of the period minus the corresponding level at baseline for the same period.
Table II. Change in fasting levels of laboratory variables in the groups when comparing the 4 week exercise period with (n = 13), or without (n = 13), intake of blueberries. Delta values denote difference from baseline to the end of the period.