
Figures & data
Table I. Characteristics of participating live kidney donors.
Figure 1. Estimated glomerular filtration rate (eGFR) at follow-up calculated with cystatin C and years after donation. Groups divided by pre-donation measured glomerular filtration rate (mGFR) ≥80 mL/min/1.73 m2 (○) and <80 mL/min/1.73 m2 (•), respectively.
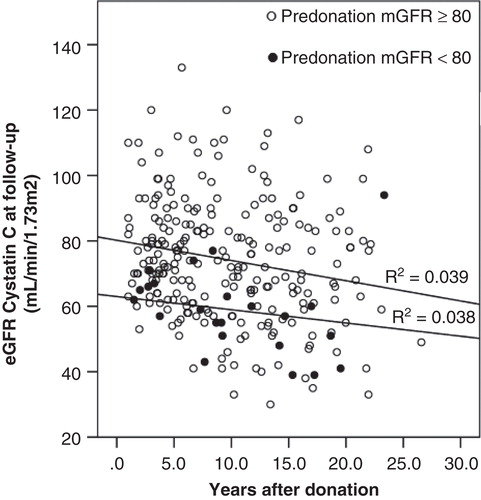
Figure 2. Glomerular filtration rate at follow-up estimated by Modification of Diet in Renal Disease (MDRD) formula mL/min/1.73 m2 (•) and cystatin C mL/min/1.73 m2 (○) according to years after donation. R2 = 0.006 and 0.025, respectively.
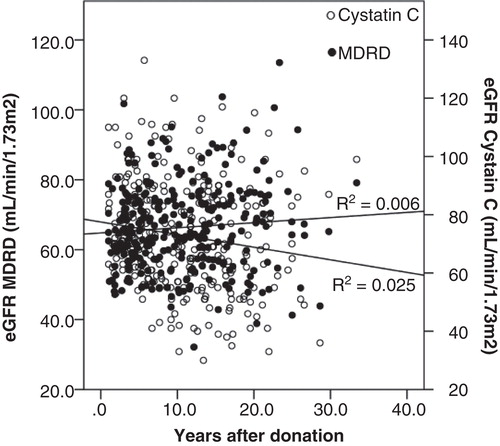
Figure 3. Estimated glomerular filtration rate (eGFR) at follow-up calculated with Modification of Diet in Renal Disease (MDRD) formula (mL/min/1.73 m2) for male and female by age categories at donation. Older age at donation is associated with lower eGFR at follow-up for both male and female donors. *p < 0.05.
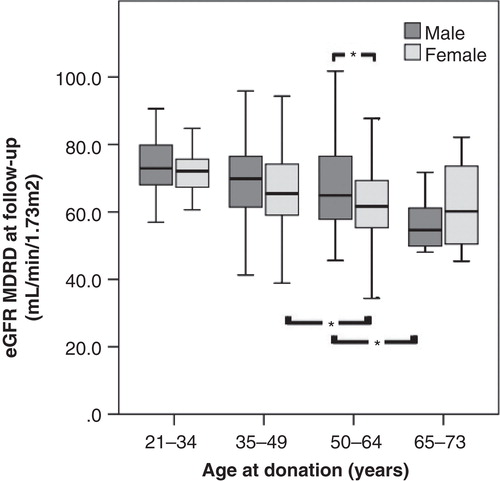
Figure 4. Level of pre-donation measured glomerular filtration rate (mGFR) mL/min/1.73 m2 showed no correlation to urine albumin-creatinine ratio (U-ACR) or mean arterial pressure (MAP) at follow-up.
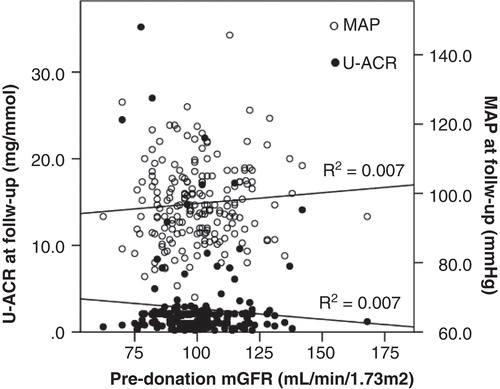
Table II. Renal function parameters (creatinine, Modification of Diet in Renal Disease (MDRD), Cockcroft–Gault and cystatin C-estimated GFR), body mass index (BMI), mean arterial pressure (MAP), and albuminuria before donation and at follow-up.