Figures & data
Figure 1. Flow chart showing those who attended the programme and filled in questionnaires at the different time points.
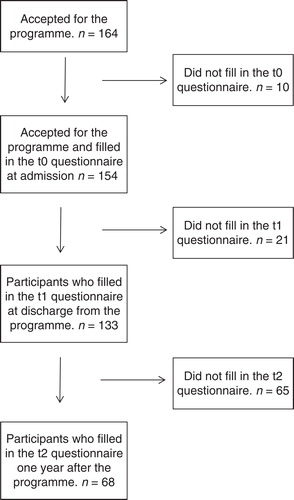
Table I. Demographic data.
Table II. Changes in LiSat-11 domains and MPI scales over time.
Figure 2. LiSat-11 outcome over time. Values represent all patients that filled in questionnaires at the different time points. Mean values, 1–6. Reference group = mean life satisfaction calculated from data collected from a nationally representative Swedish sample of 2,533 people (Citation7); * = significant change over time, based on those that responded at all three time points.
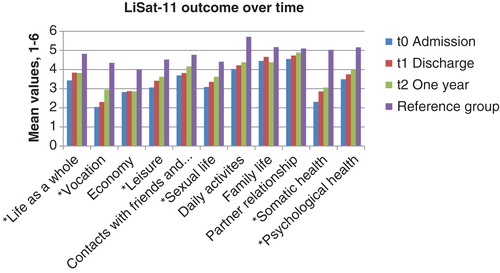
Table III. Changes in LiSat-11 domains and MPI scales over time.
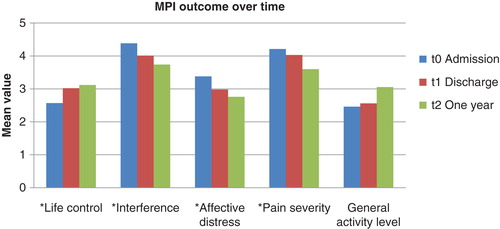
Figure 3. MPI outcome over time. Values represent all patients that filled in questionnaires at the different time points. Data used for ‘General activity level' ‘after one year' are based on only two patients and were not used for statistical analysis. * = Significant change over time based on those that responded at all three time points.