
Figures & data
Figure 1. Summary of study design with the ventilatory strategy during anaesthesia from start of preoxygenation to emergence, including the oxygen level during transport and completion of CT. n = 10 at all time points (minutes) both in the control and intervention groups.
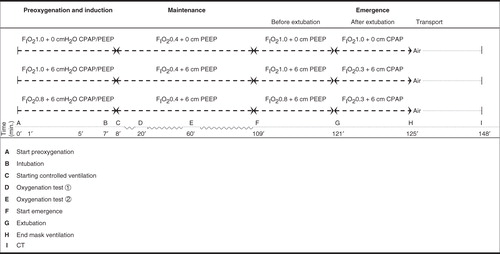
Table I. Demographic and physiologic data (median and range) for study groups.
Table II. Time data for special events during anaesthesia (median and range) in study groups.
Table III. Ventilatory data with controlled ventilation during maintenance of anaesthesia (median and range) in study groups.
Figure 2. Area of postoperative atelectasis 1 cm above the dome of the right diaphragm in the control and intervention group given FIO2 1.0, unadjusted (raw data) and adjusted for age and BMI. Boxes represent the first to the third quartile. The dark line is the median. Extended bars represent the range. *p = 0.016 (Mann–Whitney U test).
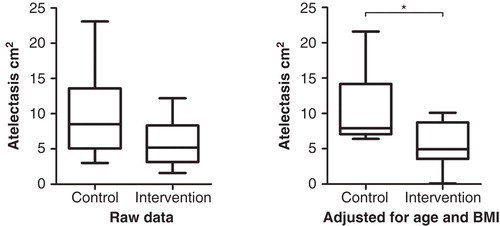
Table IV. Peripheral oxygen saturation (SpO2) (median and range) in study groups measured with FIO2 0.21.