Figures & data
Figure 1. Cetirizine does not affect diabetes development in the NOD mouse. Female NOD mice were treated from 9 to 30 weeks of age with 25 mg/kg × day with cetirizine in the drinking water. Blood samples were taken at indicated time points for the assessment of hyperglycemia. Mice were considered diabetic when the blood glucose values were >12 mM on two consecutive days. At 30 weeks of age, 10 out of 20 control mice and 12 out of 20 cetirizine-treated mice had developed diabetes (P > 0.05 using the chi-square test).
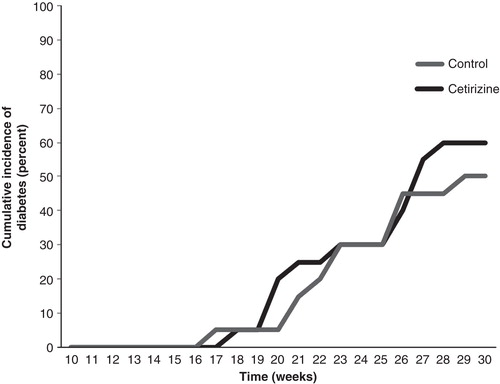
Figure 2. Weight curve of C57BL/6 mice given a normal diet or a high-fat diet from 5 to 14 weeks of age. After 7 weeks of normal diet (ND, 20 mice) and high-fat diet (HFD, 20 mice), the mice (aged 12 weeks) were divided into four groups with 10 mice in each: ND or HFD, with or without cetirizine (25 mg/kg/day) and followed for another 2 weeks.
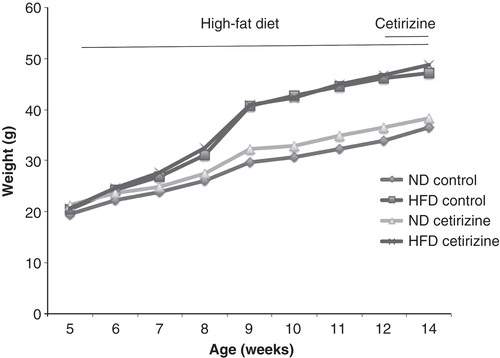
Figure 3. Non-fasting blood glucose of ND or HFD mice treated with cetirizine for 1 week. The non-fasting blood glucose concentrations were analyzed after 7 and 8 weeks of HFD, directly before start of cetirizine treatment (Day 0) and after 1 week of cetirizine treatment (Day 7). Results are means ± SEM; n = 10 for the two ND groups and 8–9 for the two HFD groups. *P < 0.05 versus corresponding ND mice using Student’s unpaired t test.
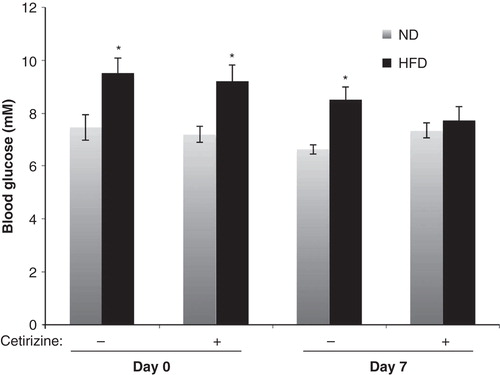
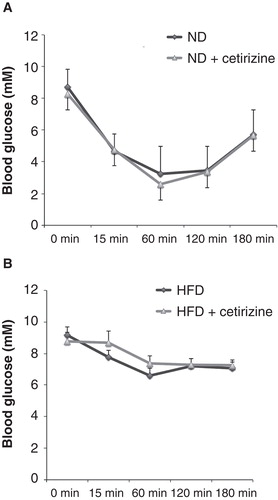
Figure 4. Glucose tolerance test of ND and HFD mice treated with cetirizine for 2 weeks. After 2 weeks of cetirizine treatment ND (A) and HFD (B) mice were fasted for 8 h and injected intravenously with glucose (2.5 g/kg). Blood glucose levels were analyzed at the time points given in the Figure. Results are means ± SEM for 8–10 mice in each group. C: Data from were recalculated to area under the curve (AUC). *P < 0.05 versus HFD mice without cetirizine treatment using the Mann–Whitney U test for non-parametric populations.
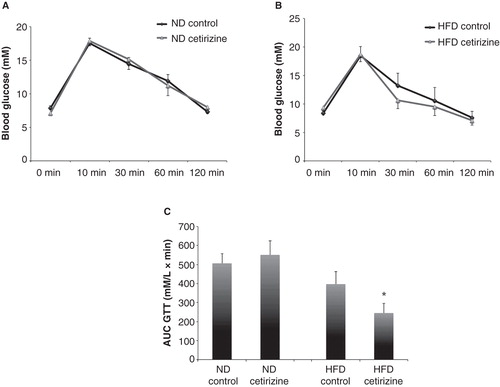
Figure 5. Insulin sensitivity test of ND (A) and HFD (B) mice treated for 2 weeks with cetirizine. Insulin (1.6 U/kg, Actrapid, Novo Nordisk, Bagsværd, Denmark) was injected intraperitoneally, and blood glucose was analyzed at the time points given. Results are means ± SEM for 8–10 mice in each group.