
Figures & data
Table I. Ethogram of the behaviors scored by direct observation or calculated during the copulatory activity tests.
Figure 2. Latency to first mount (A), intromission (B), and ejaculation (C) in the three copulatory behavior tests in male sP (n = 15) and Wistar (n = 10) rats. The latency to first mount (A) in the third test is also shown in the insert for a better illustration of the difference between sP and Wistar rats. Values represent individual data points with the median value marked as a line, and in the insert values represent median and quartile range. * p < 0.05 comparing sP and Wistar rats (Mann–Whitney U test); # p < 0.05, ## p < 0.01 compared to the first copulatory behavior test within the respective group (Wilcoxon signed rank test).
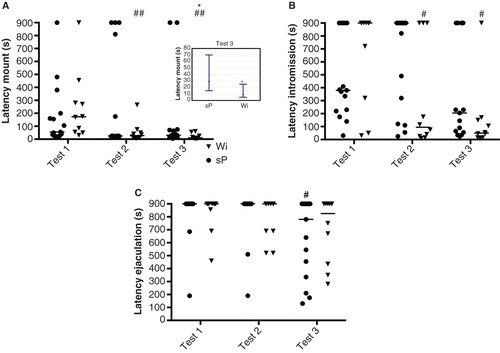
Figure 3. The number of mounts (A), intromissions (B), and sum of mounts and intromissions (C) in the three copulatory behavior tests in male sP (n = 15) and Wistar (n = 10) rats. Values represent individual data points with the median value marked as a line. # p < 0.05 compared to the first copulatory behavior test within the respective group (Wilcoxon signed rank test).
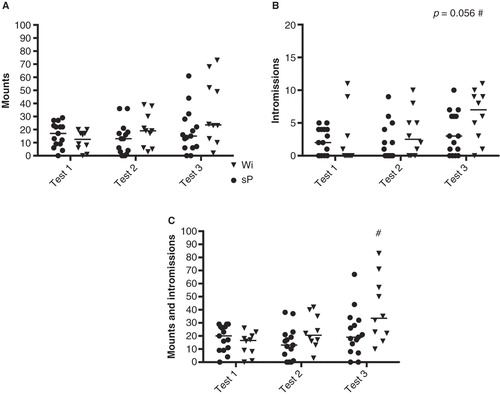
Figure 1. The percentage number of sNP (n = 15) and sP (n = 15) rats mounting (A), intromitting (B), and achieving ejaculation (C) over the three copulatory behavior tests. Due to the low number of sNP rats engaging in copulatory activity also in the third test, they were excluded from further detailed statistical analyses of copulatory behavior. Wistar (n = 10) rats were included as a reference strain. **p < 0.01, *** p < 0.001, **** p < 0.0001 compared to sP rats (chi-square test).
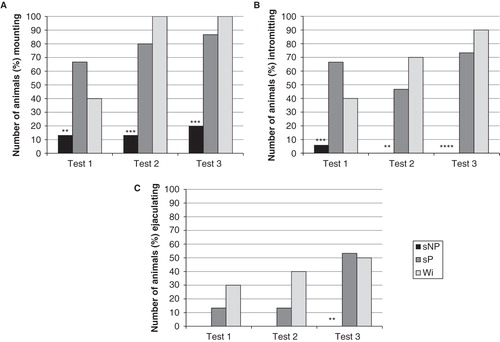
Table II. Copulatory behavior in sexually experienced sP and Wistar rats.