
Figures & data
Figure 1. Schematic drawing of the distractive–flexion stage 3 injury, DF-3. The upper vertebra is dislocated in flexion in relation to the lower one. Both facet joints are dislocated, but the overall anterior displacement is less the 50%. An observation from the creation of the injury in the specimen was that the posterior longitudinal ligament had to be torn in order to allow dislocation of the joints.
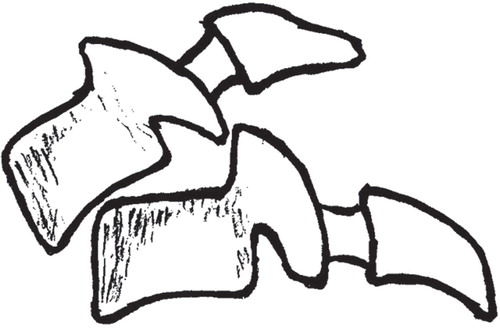
Figure 2. The test setup in the six-degree-of-freedom spinal simulator.
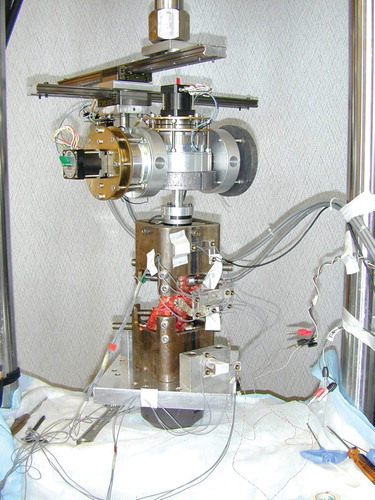
Figure 3. Various fixation methods as they were applied on the specimen mounted on plastic models. A = anterior plate alone; AW = anterior plate combined with posterior wire; AT = anterior plate combined with transarticular screws; AP = anterior plate combined with a pedicle screw–rod construct.
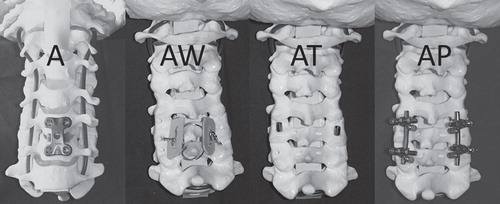
Table I. The data set. Values are percentages (angle/ intact angle).
Figure 4. Boxplots of the data set for the different testing moments. Data have been normalized and expressed as the percentage of range-of-motion for the intact specimen for each test sequence.
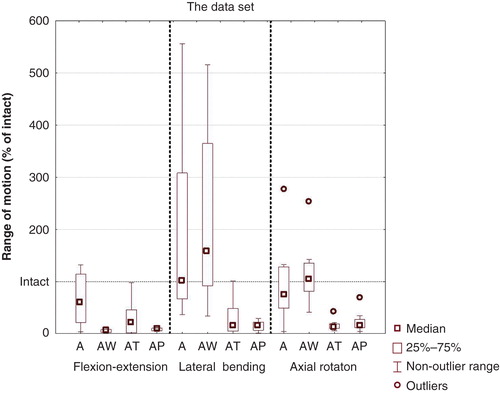
Table II. Analysis of flexion–extension. Reconstruction methods in the left column have been compared to methods in the top row. Thus, values above zero mean that the method to the left gives larger values than the method above. Entries are: Estimate (CI) p.
Table III. Analysis of lateral bending. Reconstruction methods in the left column have been compared to methods in the top row. Thus, values above zero mean that the method to the left gives larger values than the method above. Entries are: Estimate (CI) p.
Table IV. Analysis of axial rotation. Reconstruction methods in the left column have been compared to methods in the top row. Thus, values above zero mean that the method to the left gives larger values than the method above. Entries are: Estimate (CI) p.