Figures & data
Table I. Primer sequences used in the semi-quantitative real-time PCR studies.
Figure 1. Desmin staining (brown) of endogenous pancreas and implanted mouse pancreatic islets. Transplants were implanted under the renal capsule 4 weeks before study. A: There are stellate cells within the exocrine parenchyma and within the islets in the endogenous gland, with especially prominent cells seen in the islet capsule. B: Stellate cells are also associated with the capsule overlying the transplant. A few scattered cells are also seen within the graft. Scale bars 100 μm. C: The fractional area of desmin-positive cells in exocrine pancreas and within (intra-islet) or around (peri-insular) endogenous islets and transplanted islets. Values are means ± SEM for 5–6 experiments.
** P < 0.01, and *** P < 0.001 compared with the value for endogenous islets (Student’s t test).
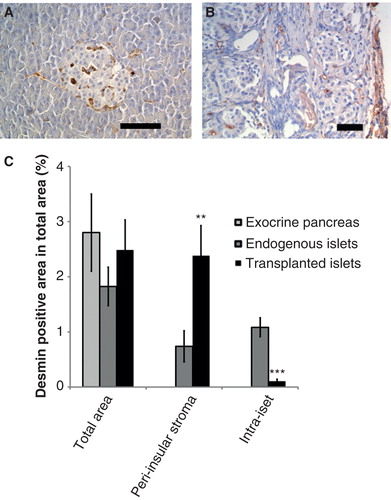
Figure 2. Isolation and identification of mouse pancreatic stellate cells. A: Pancreatic stellate cell from mouse cultured for 24 h. There are numerous lipid droplets in the cytoplasm. B: Activated pancreatic stellate cells have lost lipid droplets and attained a fibroblastoid appearance. C–E: Isolated PSCs were cultured on culture slides, and their protein expression was analyzed as described in ‘Materials and methods’. C: Desmin (green) and Nile red (denoting lipid droplet presence) (red) fluorescence in PSCs cultured for 2 days after isolation. D: Desmin (green) and α-SMA (red) immunoreactivities in PSCs cultured for 14 days after isolation. 20× magnification. E: Vimentin (green) and -SMA (red) immunoreactivities in PSCs for 14 days after isolation. Scale bars 50 m (A and C) and 100 m (B, D, E). In all micrographs Hoechst 33258 was used for nuclear staining (blue).
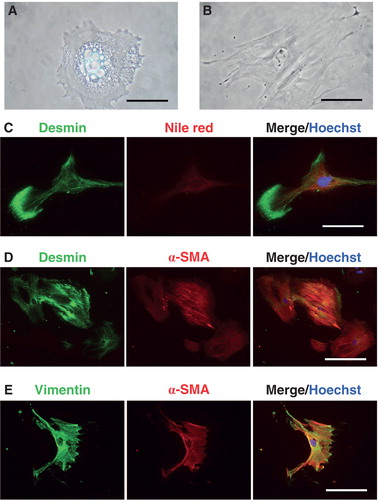
Figure 3. Mouse islet insulin release after co-culture with mouse pancreatic stellate cells. A: Insulin release into the medium at different time points after co-culture of isolated mouse islets and mouse pancreatic stellate cells. B: Islet insulin content in isolated mouse pancreatic islets after 48 h of co-culture with mouse pancreatic stellate cells. C: Insulin release from isolated mouse islets cultured alone or with either 5% (vol/vol) medium conditioned by 24 h of culture with mouse stellate cells. D: Insulin release into the medium, presented as fraction of total insulin content, from isolated mouse pancreatic islets co-cultured with isolated mouse pancreatic stellate cells. A total of 40 islets and 105 pancreatic stellate cells were present in each culture dish. During the release experiments islets were incubated in KRBH 1 h each at 1.7 and 16.7 mM glucose. Insulin concentrations were measured with either Meso Scale immunoelectrodetection (A, B) or ELISA (C, D). Values are means ± SEM for 4–9 experiments. * P < 0.05 compared with islets alone.
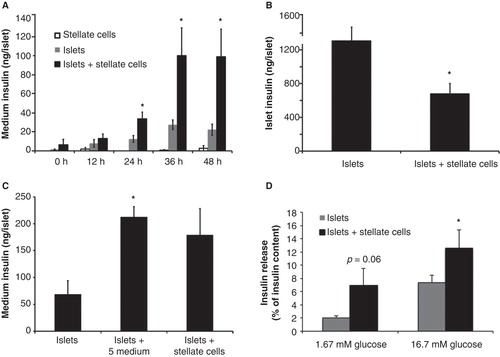
Figure 4. Effects of mouse pancreatic stellate cells on beta-cell replication. A: β-TC6 cells cultured alone or co-cultured with isolated mouse pancreatic stellate cells for 24 h. B: Isolated mouse pancreatic islets cultured without or with isolated mouse pancreatic stellate cells for 72 h. At least 3,000 cells/experimental group were counted for each observation. Values are means ± SEM for 4–5 experiments.
** P < 0.01, and *** P < 0.001 when compared with mono-cultures.
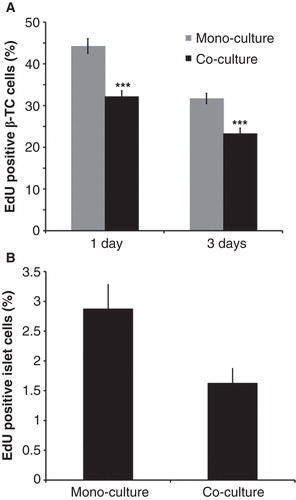
Figure 5. Effects of mouse pancreatic stellate cells on islet cell death. Fraction of caspase-3-positive cells in islets cultured alone (mono-culture) or after co-culture with isolated pancreatic stellate cells for 2 or 7 days. At least 3,000 cells were counted for each experimental group. Values are means ± SEM for 4 experiments. *** P < 0.001 when compared with the corresponding mono-culture value.
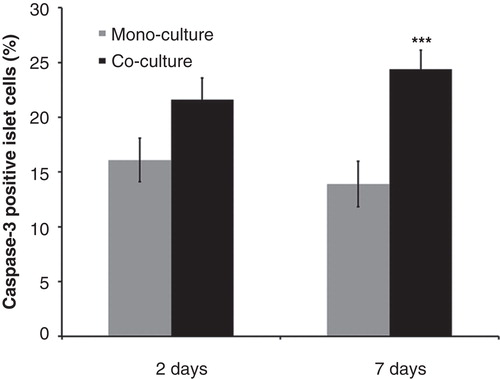
Table II. Cytokine expression in PSCs as determined by semi-quantitative real-time PCR. PSCs were either incubated for 2 h in KRBH buffer (1 h 1.67 mM followed by 1 h 16.7 mM glucose concentration or without any glucose at all for 2 h) or incubated for 96 h at different glucose concentrations.
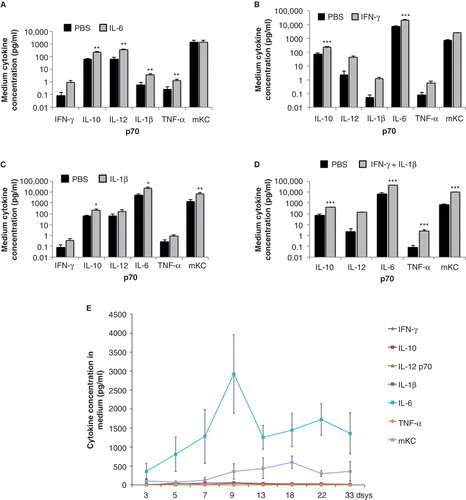
Figure 6. Medium release of interferon-γ (IFN-γ), interleukin-10 (IL-10), interleukin 12p70 (IL-12p70), interleukin-1β (IL-1β), interleukin 6 (IL-6), tumor necrosis factor-α (TNF-α), and keratinocyte-derived chemokine (mKC) from PSCs after incubation for 24 h either alone or with added cytokines. The latter consisted of IL-6 (A: 10 ng/mL), IFN-γ (B: 1,000 U/mL), IL-1β (C: 50 U/mL), or IFN-γ + IL-1β (D: 1,000 U/mL + 50 U/mL). E: Cytokine concentrations in medium from mouse pancreatic stellate cells after different times of culture. Values are means ± SEM for 3–7 experiments. Note logarithmic scale in A–D. * P < 0.05, ** P < 0.01, and *** P < 0.001 compared with the corresponding control value. In E, values for mKC and IL-6 are higher (P < 0.01) at all times compared with their respective value at day 3.