
Figures & data
Table I. PCR primers.
Table II. Summarized protein expression of SSTR1–5 in major structures identified in rat embryos from day 10 to birth.
Figure 1. The immunohistochemical staining for SSTR subtypes. A: At embryonal day 11 (SSTR1, magnification 100×); B: day 15 (SSTR2, magnification 16×); and C: day 17 (SSTR5, magnification 16×) in rat embryos. Positive staining by SSTR antibodies is highlighted by red colour. D–G: Structures in rat embryos from day 15 to birth (magnification 200×). D: positive staining of SSTR3 in the lens at day 15. E: The outer part of the skin expresses SSTR4 at day 15; F: part of the eye is positive for SSTR1 at day 19; and G: the outer part of the skin is immunostained for SSTR5 in the newborn.
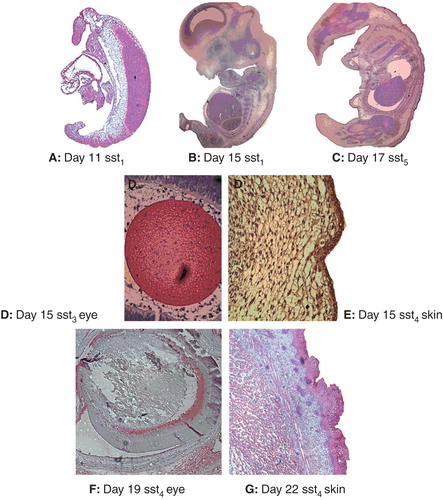
Figure 2. Expression of SSTR mRNAs in the embryonic rat pancreas amplified using real-time PCR. A: SSTR1; B: SSTR2; C: SSTR3; D: SSTR4; E: SSTR5. Data are given as mean relative expression (2-Δ(cpssts-cpTBP)) of embryonal pancreases from the same day.
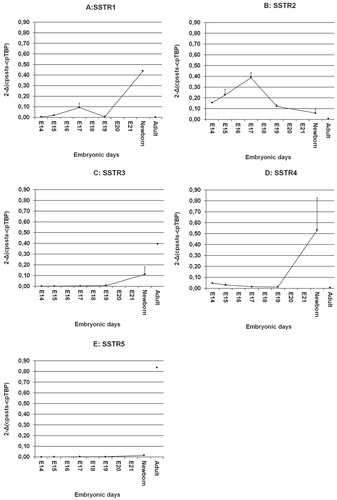
Figure 3. Expression of SSTR mRNAs of entire rat embryos amplified using real-time PCR. A: SSTR1; B: SSTR2; C: SSTR3; D: SSTR4; E): SSTR5. Embryos pooled from one pregnant rat (n = 11) were considered as one observation.
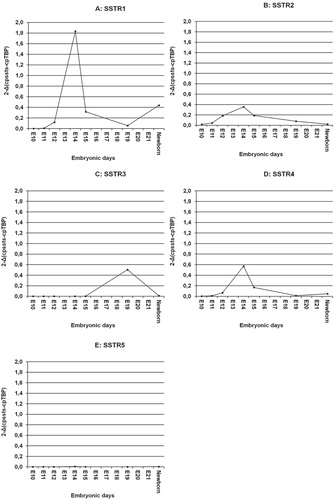
Table III. Quantitative analysis of the expression of SSTRs in β-cells, α-cells, δ-cells, or PP-cells in the fetal rat pancreas from day 19, 21 and in the newborn. Percentages are proportion of cells in which immunofluorescence was detected.