Figures & data
Table 1. Clinical and laboratory data of the patients with RA and OA who were studied for gene expression profiling in synovial tissue.
Figure 1. Microdissection of the synovial lining in RA. (A) After toluidine blue staining, a section was subjected to LMD. The sample was observed on the PC monitor and the lining area was marked. (B) The sample was cut with a laser beam along the defined line. (C) After microdissection, the sample was collected by gravity into a tube cap. In this manner, we obtained more than 5000 cells from the RA or OA synovial lining sections.
Figure 2. Gene-expression clustering in RA and OA. (A) Cluster with 197 genes (after SAM analysis of normalized 14 519 genes; criterion: FC RA/OA ≥ 2.0 or ≤ 0.5, FDR < 0.001). The dendrogram shows the major groups, that is RA (subgroups: high RA and low RA) and OA groups. (B) Heatmap of selected genes. Expression of chemokines (CCL5 and CXCL9/10) and transcription factors (IRF1 and STAT1) were selected and analysed using GeneSpring software. The levels of these genes are more strongly up-regulated in RA than in OA. The colour intensity indicates the magnitude of the deviation from the median (yellow). Red represents relative expression levels higher than the median level across all tissues and blue represents lower expression levels.
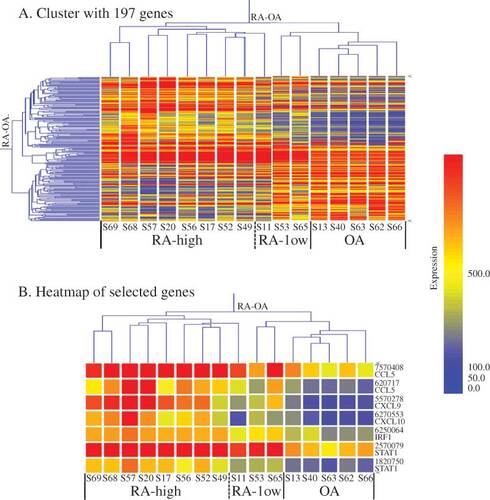
Figure 3. List of top 20 up- and down-regulated genes from the filtered 197 genes. The upper panel shows the top 20 genes from 121 up-regulated genes (RA/OA) on the basis of Fold Change (FC). The lower panel is a list of the bottom 20 genes from 76 down-regulated genes.
Figure 4. Gene network generated through the use of Ingenuity Pathway Analysis (IPA). IPA was applied to TNF, chemokines (CCL5, CXCL9/10), and transcription factor (STAT1 and IRF1) genes to create a network inter-related to inflammatory mediator genes. Interacting nodes are defined by either direct relationships, which require direct physical contact (solid arrows), or indirect relationships (dashed arrows). The direction of the arrows shows the direction of the interaction. The blue line indicates the connection with STAT1. Red molecules indicate higher expression in RA than in OA at the gene level.
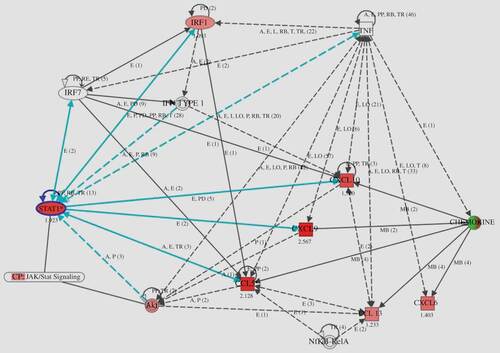
Table 2. List of up- and down-regulated genes (chemokines and transcription factors).
Figure 5. Immunohistochemical staining of the synovium from (A, C, E, F, and G) RA and (B and D) OA patients. (A and B) anti-CCL5; (C and D) anti-STAT1; (E) anti-IRF1; (F) anti-CXCL9; (G) anti-CXCL10. Significant presence of all antigens was detected in the synovial lining cells of RA but not of OA.
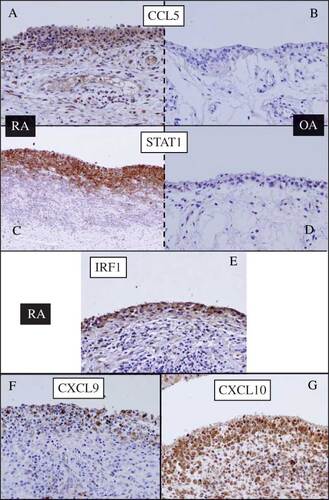
Figure 6. Relationship between STAT1 and CCL5 established by immunohistochemical analysis. Expression of STAT1 and CCL5 at the protein level is higher in the synovial cells of RA (n = 25) than in those of OA (n = 10). The STAT1 score correlates significantly with the CCL5 score (r = 0.93, p < 10–6).