Figures & data
Table 1. One year increments of body mass index (ΔBMI) according to sex, age and percentile in a sample of 1167 Norwegian children between 2003–2007.
Table 2. One year increments of BMI SDS (ΔBMI SDS) according to sex, age and percentile in a sample of 1167 Norwegian children between 2003–2007.
Table 3. Results from linear regression analysis of 1 year increments of BMI in 1167 Norwegian children (576 boys), 6.00–14.99 years of age/
Table 4. Results from linear regression analysis of 1 year increments of BMI SDS in 1167 Norwegian children (576 boys), 6.00–14.99 years of age.
Figure 1. Correlation between standard deviation scores of the BMI (BMI SDS) and BMI SDS after 1 year in annual age groups from 6.00–14.99 years of age.
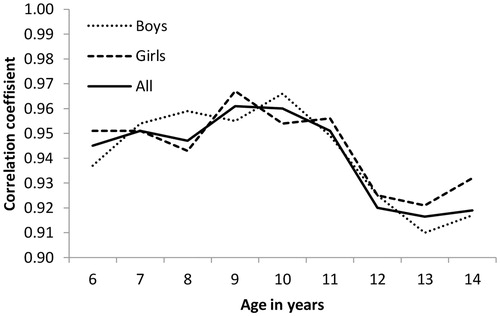
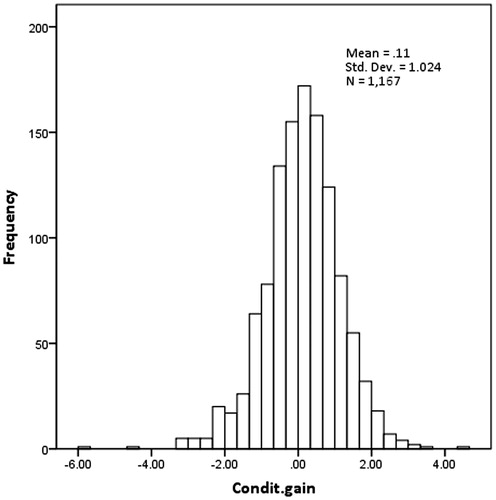
Figure 2. Distribution of standard deviation scores of 1 year conditional change in BMI in 1167 Norwegian children from 6.00–14.99 years of age.