Figures & data
Table 1 Characteristics of the Mouse Food AIN-76-A Diet Modified to 10% w/dry w Corn Oil or 2.63% Corn Oil and 18% of Calories from Walnut
Figure 1 Body weights (±SEM) of the control-fed and walnut-fed animals following the subcutaneous inoculation of tumor cells. The animals had been randomly divided before the specific diets were initiated and the difference in the body weights was not believed to be due to the diets per se but was coincidental. During the first 100 days of the study, the groups gained body weight at the same rate. We took this as evidence that the mice were consuming equivalent amounts of diet. Near the end of the experimental period (after 100 days), the curves begin to diverge due to the reduced body weights of the large tumor bearing mice. The initial body weights differed with a p < 0.05 (t-test); at most time points thereafter this difference persisted.
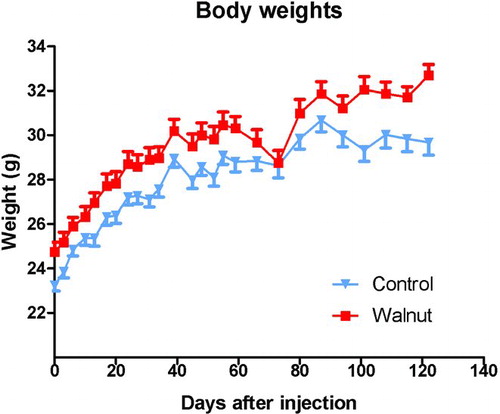
Figure 2 Tumor onset and number of animals that developed tumors in the control and walnut diet-fed mice. The first tumor appeared in the control diet-fed animal during week 3. Thereafter, only two other mice developed overt tumors so 3 of 16 mice (18.7%) had a tumor at the conclusion of the study. Conversely, the first tumor in a walnut-fed mouse was detected during the fourth week. Thereafter, there was a steady increase in the number of mice that developed tumors until the 14th week of the study when 14 of 32 mice (44.0%) had a subcutaneous prostate cancer. These data were independently analyzed by WEH and William W. Morgan using the following procedures: Chi-square test with the Yates correction and two-tailed Fisher's exact test. Using these procedures yielded no statistically significant differences. There was agreement that the small number of tumors (three each) in the walnut-fed animals negated statistical differences.
Figure 3 Summary of the calculated tumor sizes (±SEM) during the course of the study in the control-fed and walnut-fed mice. The calculated size of the three tumors in the walnut-fed mice remained small throughout the study while those in the control-fed animals continued to grow. The tumor volumes in the control animals near the end of the study varied widely among the animals. These data were analyzed independently by statisticians WEH and William W. Morgan using the Mann–Whitney U and the Kruskal–Wallis test, neither of which yielded statistical significance. This again was likely due to the small number of tumors in the walnut-fed animals and the large variation in tumor sizes.
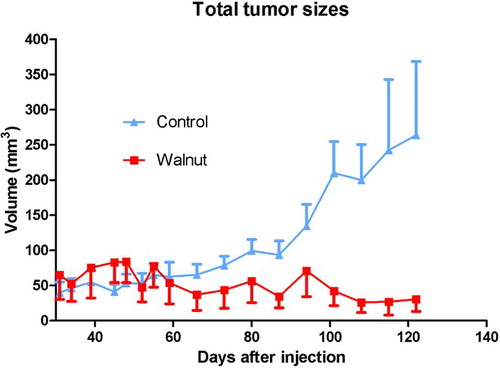
Figure 4 This figure depicts the final tumor weights in the control-fed and walnut-fed animals at the conclusion of the study. The value identified with a † was estimated and was not used to calculate the mean tumor weight; it was found in a mouse that had been dead for a number of hours. The histograms indicate the mean tumor weights. As with the tumor volume, because of the small number of tumors that grew in the walnut fed mice (three each) and due to the large variation in tumor size, the median tumor weights did not differ between the groups when tested using either the Mann–Whitney U or Kruskal–Wallis tests.
Figure 5 Average sized tumor (0.12% of final body weight) from a walnut-fed mouse and the largest tumor (1.24%) from a control mouse at the conclusion of the study. In comparison, the maximal diameter of the small tumor in this figure is 6 mm.
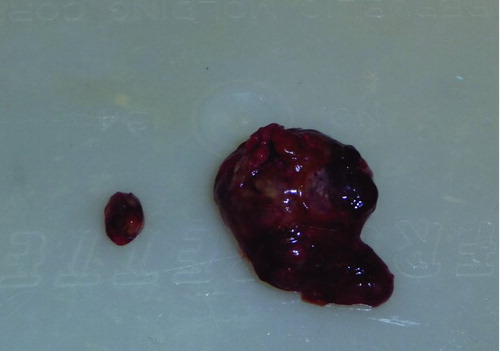
Figure 6 Levels of F2-isoprostanes, a measure of lipid peroxidation, in the liver of control-fed and walnut-fed mice. The presence of the tumor in the control-fed mice did not impact the level of hepatic lipid peroxidation products. The walnut diet reduced basal levels of lipid peroxidation (p < 0.05; Kruskal–Wallis test) in the liver.