Publication Cover
Chronobiology International
The Journal of Biological and Medical Rhythm Research
Volume 30, 2013 - Issue 4
3,724
Views
42
CrossRef citations to date
0
Altmetric
Research Papers

Human Chronotype Is Determined in Bodily Cells Under Real-Life Conditions

, &
Pages 607-617 | Received 09 Aug 2012, Accepted 21 Nov 2012, Published online: 27 Feb 2013

Figures & data

TABLE 1. Characterization of subjects involved in the study

FIGURE 1.  Melatonin profiles and their correlation with chronotype. (A) Grouped 24-h melatonin profiles for subjects with early (full circle) and late (full square) chronotypes. The data were expressed as the mean ± SEM (each chronotype n = 6) and fitted with a cosine curve to determine the acrophase of the rhythms. The acrophase of the early chronotypes (full line) occurred earlier than those of the late chronotypes (dashed line). (B) Relationship between acrophases of the 12 individual melatonin profiles (means ± SD) and their corresponding individual mid-sleep phases corrected for the sleep debt accumulated during workdays (MSFSC). The solid line shows the best-fit linear regression, the dashed lines represent 95% confidence intervals to the regression line, and R2 represents the goodness of fit. For details see Materials and Methods.
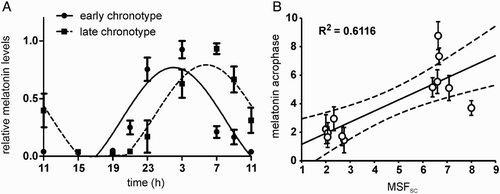
FIGURE 1.  Melatonin profiles and their correlation with chronotype. (A) Grouped 24-h melatonin profiles for subjects with early (full circle) and late (full square) chronotypes. The data were expressed as the mean ± SEM (each chronotype n = 6) and fitted with a cosine curve to determine the acrophase of the rhythms. The acrophase of the early chronotypes (full line) occurred earlier than those of the late chronotypes (dashed line). (B) Relationship between acrophases of the 12 individual melatonin profiles (means ± SD) and their corresponding individual mid-sleep phases corrected for the sleep debt accumulated during workdays (MSFSC). The solid line shows the best-fit linear regression, the dashed lines represent 95% confidence intervals to the regression line, and R2 represents the goodness of fit. For details see Materials and Methods.
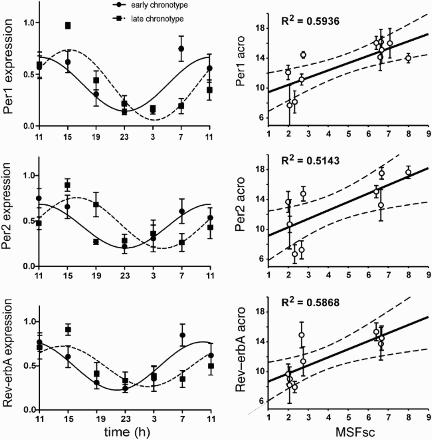
TABLE 2. Results of cosinor analysis of individual daily profiles of melatonin and clock gene expression levels

FIGURE 3.  Clock gene expression profiles and their correlation with chronotype. Left panel: Grouped 24-h Per1 (upper), Per2 (middle), and Rev-erbα (lower) expression profiles for subjects with early (full circle) and late (full square) chronotypes. The data were expressed as the mean ± SEM (each chronotype n = 6) and fitted with a cosine curve to determine the acrophase of the rhythms. The acrophase of the early chronotypes (full line) occurred earlier than those of the late chronotypes (dashed line). Right panel: Relationship between the acrophases of the individual Per1 (upper), Per2 (middle), and Rev-erbα (lower) expression profiles (means ± SD) and the individual's mid-sleep phase corrected for the sleep debt accumulated during workdays (MSFSC). Only profiles with significant cosine fits (see Table 2) were considered for correlation (Per1: n = 11; Per2: n = 10; Rev-erbα: n = 9). The solid line shows the best-fit linear regression, the dashed lines represent 95% confidence intervals to the regression line, and R2 represents the goodness of fit. For details see Materials and Methods.
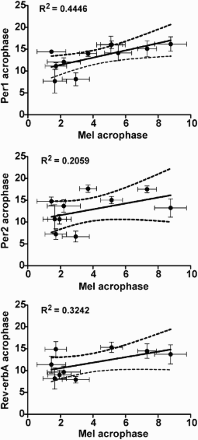
FIGURE 3.  Clock gene expression profiles and their correlation with chronotype. Left panel: Grouped 24-h Per1 (upper), Per2 (middle), and Rev-erbα (lower) expression profiles for subjects with early (full circle) and late (full square) chronotypes. The data were expressed as the mean ± SEM (each chronotype n = 6) and fitted with a cosine curve to determine the acrophase of the rhythms. The acrophase of the early chronotypes (full line) occurred earlier than those of the late chronotypes (dashed line). Right panel: Relationship between the acrophases of the individual Per1 (upper), Per2 (middle), and Rev-erbα (lower) expression profiles (means ± SD) and the individual's mid-sleep phase corrected for the sleep debt accumulated during workdays (MSFSC). Only profiles with significant cosine fits (see Table 2) were considered for correlation (Per1: n = 11; Per2: n = 10; Rev-erbα: n = 9). The solid line shows the best-fit linear regression, the dashed lines represent 95% confidence intervals to the regression line, and R2 represents the goodness of fit. For details see Materials and Methods.

FIGURE 4.  The relationship between the acrophases of the individual melatonin profiles and individual profiles of Per1 (upper), Per2 (middle), and Rev-erbα (lower) expression (means ± SD). Only profiles with significant cosine fits (see Table 2) were considered for correlation (Per1: n = 11; Per2: n = 10; Rev-erbα: n = 9). The solid line shows the best-fit linear regression, the dashed lines represent 95% confidence intervals to the regression line, and R2 represents the goodness of fit. For details see Materials and Methods.

FIGURE 4.  The relationship between the acrophases of the individual melatonin profiles and individual profiles of Per1 (upper), Per2 (middle), and Rev-erbα (lower) expression (means ± SD). Only profiles with significant cosine fits (see Table 2) were considered for correlation (Per1: n = 11; Per2: n = 10; Rev-erbα: n = 9). The solid line shows the best-fit linear regression, the dashed lines represent 95% confidence intervals to the regression line, and R2 represents the goodness of fit. For details see Materials and Methods.

FIGURE 2.  Evaluation of the method used for determining the phase of the clock gene expression profiles. Samples of buccal scrubs were collected throughout the 24 h in the same subject in three independent sessions. (A) Individual profiles of Per1 (upper), Per2 (middle), and Rev-erbα (lower) resulting from three independent assays. (B) Average profiles (means ± SEM.) of Per1 (upper), Per2 (middle), and Rev-erbα (lower) of the three measurements. For details see Materials and Methods.
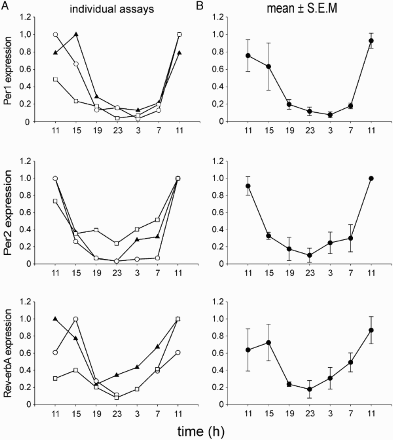
FIGURE 2.  Evaluation of the method used for determining the phase of the clock gene expression profiles. Samples of buccal scrubs were collected throughout the 24 h in the same subject in three independent sessions. (A) Individual profiles of Per1 (upper), Per2 (middle), and Rev-erbα (lower) resulting from three independent assays. (B) Average profiles (means ± SEM.) of Per1 (upper), Per2 (middle), and Rev-erbα (lower) of the three measurements. For details see Materials and Methods.

Reprints and Corporate Permissions

Please note: Selecting permissions does not provide access to the full text of the article, please see our help page How do I view content?

To request a reprint or corporate permissions for this article, please click on the relevant link below:

Academic Permissions

Please note: Selecting permissions does not provide access to the full text of the article, please see our help page How do I view content?

Obtain permissions instantly via Rightslink by clicking on the button below:

If you are unable to obtain permissions via Rightslink, please complete and submit this Permissions form. For more information, please visit our Permissions help page.