Figures & data
Figure 1. Schematic representation of study protocol and spectral transmission profile of filtered light. Nine full-time nurses participated in the 8-wk study (A). Each participant completed 8 wks consisting of 2-wk rotation periods of alternating night and day shifts (gray bars). Working days were separated by two to three non-workdays (white bars). Participants were randomized in a crossover design (marked by X) to receive glasses fitted with short-wavelength filters (0% transmission <480 nm) to be used only during night shifts (intervention) or exposed to regular unfiltered ambient artificial light (baseline). Sleep and alertness under baseline and intervention conditions (red hashed bar and red filled circles) were compared with nighttime sleep after the seventh day shift (polysomography) and alertness measures taken during the seventh day shift on the second 2-wk day shift period (comparator; blue hashed bar and blue filled circles). Baseline and intervention for nighttime and daytime sleep were assessed on four separate occasions by polysomnography (red hashed bars). Subjective and objective measures of alertness and saliva samples for melatonin assays were collected every 2 h on the first and fourth night shifts under baseline and intervention conditions (red filled circles). Transmission profile (B) of the filtered light (blue line) was generated against a standard fluorescent light source (black dashed line), demonstrating the effective visual short-wavelength range (<480 nm; gray-shaded region) removed by the interference filters.
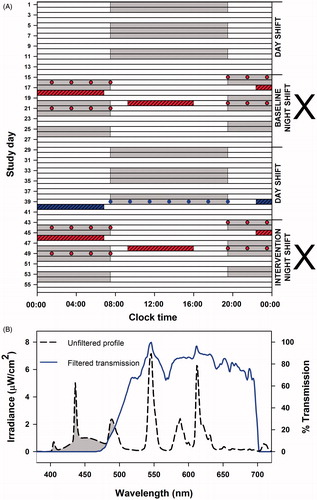
Table 1. Effects of filtering visual short wavelengths (<480 nm) on nighttime sleep structure variables.
Table 2. Effects of filtering visual short wavelengths (<480 nm) on daytime sleep structure variables.
Figure 2. Changes in melatonin levels during night shifts with exposure to visual short-wavelength-filtered light and standard ambient artificial light. Melatonin levels were significantly higher under intervention (exposure to short-wavelength [<480 nm]-filtered light during night shifts) as compared with baseline (exposure to standard unfiltered ambient light during night shifts) on the first night shift (A) and middle night shift of a series of three consecutive night shifts (B). Individual profiles are presented as gray lines and group mean ± SEM profiles are presented as blue lines. Mean melatonin profiles are compared between the two conditions and two nights of testing (C). Data were subjected to two-factor (group × time) mixed-model ANOVA for the first and fourth night shifts individually. Statistically significant values at specific times as revealed by post hoc analysis are represented by *. Percentage change in melatonin AUC between baseline and intervention conditions on the first and second nights were calculated to assess changes in melatonin levels on an individual basis (D). Group mean ± SEM for each night is expressed as the bars and individual levels are expressed as gray filled circles. The change in AUC was significantly greater on the fourth night as compared with the first night.
![Figure 2. Changes in melatonin levels during night shifts with exposure to visual short-wavelength-filtered light and standard ambient artificial light. Melatonin levels were significantly higher under intervention (exposure to short-wavelength [<480 nm]-filtered light during night shifts) as compared with baseline (exposure to standard unfiltered ambient light during night shifts) on the first night shift (A) and middle night shift of a series of three consecutive night shifts (B). Individual profiles are presented as gray lines and group mean ± SEM profiles are presented as blue lines. Mean melatonin profiles are compared between the two conditions and two nights of testing (C). Data were subjected to two-factor (group × time) mixed-model ANOVA for the first and fourth night shifts individually. Statistically significant values at specific times as revealed by post hoc analysis are represented by *. Percentage change in melatonin AUC between baseline and intervention conditions on the first and second nights were calculated to assess changes in melatonin levels on an individual basis (D). Group mean ± SEM for each night is expressed as the bars and individual levels are expressed as gray filled circles. The change in AUC was significantly greater on the fourth night as compared with the first night.](/cms/asset/7a810fb0-78f8-45c9-bae0-3f31822be3c8/icbi_a_789894_f0002_b.jpg)
Figure 3. Correlation between percentage change in melatonin AUC between baseline and intervention conditions on the first night shift and the change in nighttime sleep structure variables. There was a significant correlation between the change in melatonin AUC between baseline and intervention conditions on the first night shift and change in nighttime sleep efficiency (A) and total sleep time (B) between baseline and intervention conditions but there was no correlation between the same variables for daytime sleep (C and D).
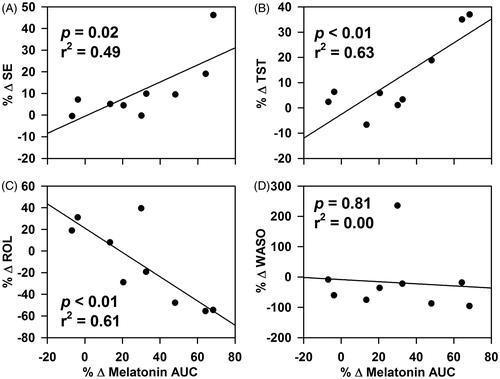
Figure 4. Effects of filtering short wavelengths (<480 nm) from ambient light during night shifts on subjective and objective measures of alertness. Alertness measures were conducted every 2 h from start to the end of the shift on the first night shift and the middle night shift in a series of three night shifts under baseline (black filled circles and black line) and intervention (blue filled triangles and blue line) conditions and the seventh day shift used as the comparator condition (gray filled squares and gray line). Tests included one-choice reaction task, response inhibition (GO/NO-GO) task, and subjective sleepiness. Data represent mean ± SEM. Data were subjected to two-factor (group × time) mixed-model ANOVA followed by Dunnett’s post hoc analysis using the comparator as the control group.
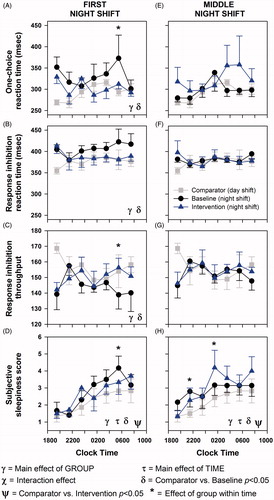
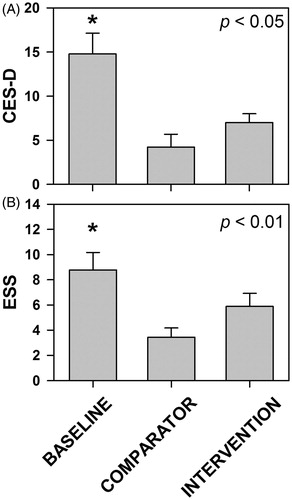
Figure 5. Effects of filtering short wavelengths (<480 nm) from ambient light during night shifts on subjective mood and daytime sleepiness. Subjective mood and daytime sleepiness were assessed at the end of each study week using the CES-D (A) and ESS (B) scales, respectively. Data represent mean ± SEM. Data were subjected to two-factor (group × time) mixed-model ANOVA followed by Dunnett’s post hoc analysis using the comparator as the control group. *Statistically different as compared with the comparator condition.