
Figures & data
FIGURE 1. Top: Four histograms depict distribution according to clock hour of circadian acrophases (φs) of seven different categories of variables. Upper left histogram: 37 physiologic and 32 cognitive performance variables; Upper right histogram: 14 serum inorganic and 25 serum organic variables; Lower left histogram: 18 circulating blood cell and 15 serum enzyme variables; Lower right histogram: 27 serum hormone variables. Each vertical column indicates the proportion of circadian φs per variable category occurring according to clock-hour time. Bottom: Dendrogram depicts by line segment length correlation of the distribution of circadian φs between different pairings of the specified seven different categories of variables: the shorter the line segment length, the poorer the correlation and the greater the dissimilarity of the distribution of φs between designated categories of variables; the longer the line segment length, the stronger the correlation and the greater the similarity of the φs distribution between designated categories of variables. Circadian φs of the physiologic and cognitive categories are most strongly correlated (r = +0.8) (After Ticher et al., Citation1995; Reinberg et al., Citation2015).
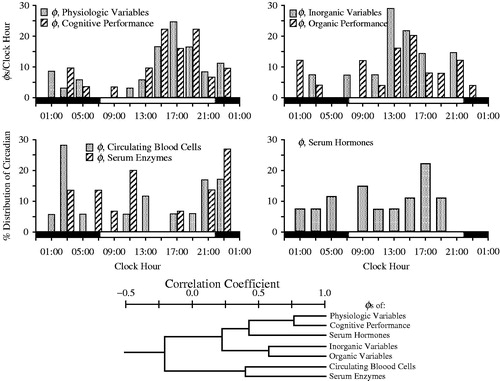
FIGURE 2. Age-related changes in melatonin circadian rhythm investigated by around-the-clock assessment of the urinary excretion of its metabolite – 6-sulfatoxymelatonin (aMT6s). Urines were collected from subjects adhering to a routine of nocturnal sleep in darkness (dark shading along bottom time axis) alternating with diurnal activity (non-shaded portion of bottom time axis) at ∼4 h intervals during a single 24 h span. aMT6s values ( ± S.E.) are plotted as midpoint time of the respective 4 h urine collections. Across all age groups, aMT6s concentration is greatest in the middle of the night and lowest midday. Mean nocturnal aMT6s is somewhat greater in young adults ∼22 yrs of age (n = 43) than children ∼11 yrs of age (n = 193), and lowest in the elderly (n = 271 in total), particularly the oldest (∼81 yrs of age) age group (Previously unpublished data of E. Haus & L. Sackett-Lundeen).
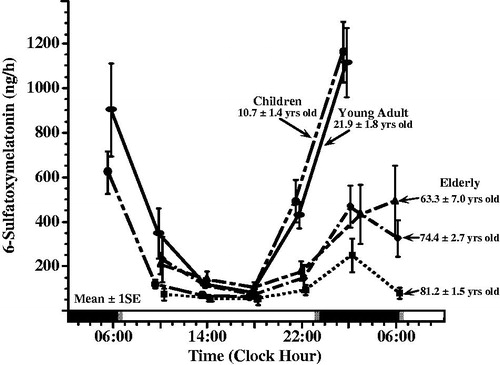
FIGURE 3. Mean (±S.E.) 24 h urinary melatonin metabolite 6-sulfatoxymelatonin (aMT6s) concentration expressed relative to creatinine concentration of dayshift nurses (n = 7), who maintained their diurnal activity/nocturnal sleep routine, studied on work and off days (n = 268 urine samples in total) and nightshift nurses (n = 12), who adopted a daytime sleep/nighttime activity routine when working nightshifts but with napping at work allowed when feasible, studied during duty nights (n = 224 urine samples in total) and also off nights (n = 275 urine samples). Void-by-void urines were self-collected around the clock by day nurses who worked 6 h shifts 6 day/wk and also by night nurses who worked 12 h nightshifts every other night and who had 36 h off-work periods every other "day". Night nurses exhibit a significantly lower mean aMT6s (i.e., melatonin suppression) on both work and off days compared to dayshift nurses on work and also off days (ANOVA; p < 0.0001); mean 24 h urinary 6-sulfatoxymelatonin/ng creatinine concentration of nightshift nurses, both on and off work nights, is ∼40% less than that of dayshift only nurses, both on work days and off days. [Figure constructed using previously unpublished data collected by Borges et al. (Citation2007, Citation2008)].
![FIGURE 3. Mean (±S.E.) 24 h urinary melatonin metabolite 6-sulfatoxymelatonin (aMT6s) concentration expressed relative to creatinine concentration of dayshift nurses (n = 7), who maintained their diurnal activity/nocturnal sleep routine, studied on work and off days (n = 268 urine samples in total) and nightshift nurses (n = 12), who adopted a daytime sleep/nighttime activity routine when working nightshifts but with napping at work allowed when feasible, studied during duty nights (n = 224 urine samples in total) and also off nights (n = 275 urine samples). Void-by-void urines were self-collected around the clock by day nurses who worked 6 h shifts 6 day/wk and also by night nurses who worked 12 h nightshifts every other night and who had 36 h off-work periods every other "day". Night nurses exhibit a significantly lower mean aMT6s (i.e., melatonin suppression) on both work and off days compared to dayshift nurses on work and also off days (ANOVA; p < 0.0001); mean 24 h urinary 6-sulfatoxymelatonin/ng creatinine concentration of nightshift nurses, both on and off work nights, is ∼40% less than that of dayshift only nurses, both on work days and off days. [Figure constructed using previously unpublished data collected by Borges et al. (Citation2007, Citation2008)].](/cms/asset/040c25a5-7539-4ea2-bf38-7bf15693bed0/icbi_a_1072002_f0003_b.jpg)
FIGURE 4. Circadian timing (acrophase, φ) of each of six urinary variables (volume = urine volume; potassium = urinary potassium concentration; sodium = urinary sodium concentration; HMMA = 4-hydroxy-3-methoxymandelic acid: measure of urinary catecholamines concentration; 17-OHCS = 17-hydroxycorticosteroids: urinary metabolite of glucocorticosteroids, and 5-HIAA = 5-hydroxyindoleacetic acid: urinary metabolite of serotonin) determined from voidings collected from (n = 5) male shift workers upon awakening, at regular intervals during daytime waking, and before retiring to sleep on work and off days throughout a continuous ≥50-day span while adhering to an employee-selected (and industry approved) backward-in-direction rapid 3 to 4-day rotation shift schedule (dayshift: 07:00–16:00 h; nightshift: 21:00–06:00 h; morning shift: 06:00–13:00 h; evening shift: 13:00–21:00 h). Each graph shows the group circadian acrophase (φ: peak time and also 95% confidence interval when group circadian rhythmicity is substantiated by Cosinor analysis) per study variable for the 1st, 2nd, and 3rd + 4th day of the respective shifts in relation to both the associated sleep/wake pattern of the workers (blackened portion of lower time axis plus gray shaded background of each of graph) and midwork time (bold black vertical line). The φ of each of the variables for the daytime activity/nocturnal sleep routine of off days (OD) and normal day (ND) shifts occurs before or around the middle of the activity span, within the 6 h following waking. The φs of the study variables are most misaligned in timing relative to the sleep/wake schedule and midwork time when the nighshift is worked, which constitutes greatest alteration (∼8 h change) in the sleep/wake circadian rhythm relative to the dayshift or off days conditions; this is particularly apparent the 1st nightshift when some φs are timed during daytime sleep rather than during nighttime work. By the 3rd and 4th day, no matter the work shift, nearly complete or complete adjustment of the φ relative to worker sleep/wake cycle of most if not all the studied circadian variables is achieved (Redrawn from Vieux et al., Citation1979).
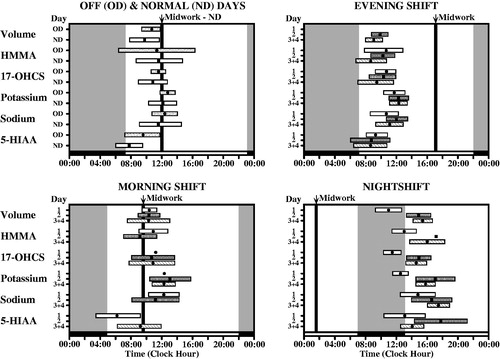
FIGURE 5. Sleep duration (x ± S.D.) of (n = 304) radio and television and airport transport and freight shift workers according to the clock time when sleep was initiated (starting time of sleep). When sleep must be scheduled during the day due to night work, it is never >6 h in duration on average, and when initiated, in particular, between 13:00 and 19:00 h, it is not >4 h in duration on average (Redrawn from Knauth & Rutenfranz, Citation1981).
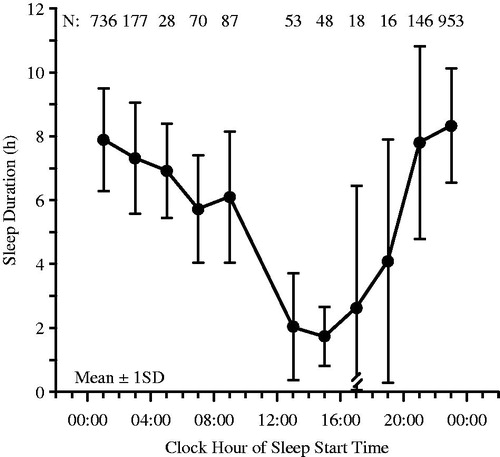
FIGURE 6. Data (x ± SE) from the same aMT6 nursing study as for , however, with focus only on nightshift nurses (12 h night shift [19:00–07:00 h] followed by 36 h off time) categorized according to more (n = 8) versus less (n = 4) tolerance to night work (Borges et al., Citation2008). Tolerance to night work was determined by self-assessment of fatigue, sleep disturbances, insomnia, sleepiness, minor psychological symptoms, and satisfaction with free (off-work) time, with those presenting ≥2 of these complaints considered less tolerant and those presenting with none or only 1 of them considered more tolerant. Nightshift nurses having more compared to less tolerance to their working arrangement exhibit higher mean aMT6s concentration when working during the night and sleeping during the day as well as during off days when adhering to a normal diurnal activity/nocturnal sleep routine. The difference between the less and more tolerant nightshift groups in mean aMT6s concentration for the combination of the work and off days is statistically significant (ANOVA; p < 0.05). [Figure constructed using previously unpublished data collected by Borges et al. (Citation2007, Citation2008)].
![FIGURE 6. Data (x ± SE) from the same aMT6 nursing study as for Figure 3, however, with focus only on nightshift nurses (12 h night shift [19:00–07:00 h] followed by 36 h off time) categorized according to more (n = 8) versus less (n = 4) tolerance to night work (Borges et al., Citation2008). Tolerance to night work was determined by self-assessment of fatigue, sleep disturbances, insomnia, sleepiness, minor psychological symptoms, and satisfaction with free (off-work) time, with those presenting ≥2 of these complaints considered less tolerant and those presenting with none or only 1 of them considered more tolerant. Nightshift nurses having more compared to less tolerance to their working arrangement exhibit higher mean aMT6s concentration when working during the night and sleeping during the day as well as during off days when adhering to a normal diurnal activity/nocturnal sleep routine. The difference between the less and more tolerant nightshift groups in mean aMT6s concentration for the combination of the work and off days is statistically significant (ANOVA; p < 0.05). [Figure constructed using previously unpublished data collected by Borges et al. (Citation2007, Citation2008)].](/cms/asset/a0c3011a-9be9-46f3-910c-3023055a8cef/icbi_a_1072002_f0006_b.jpg)